Fig. B.4
Download original image
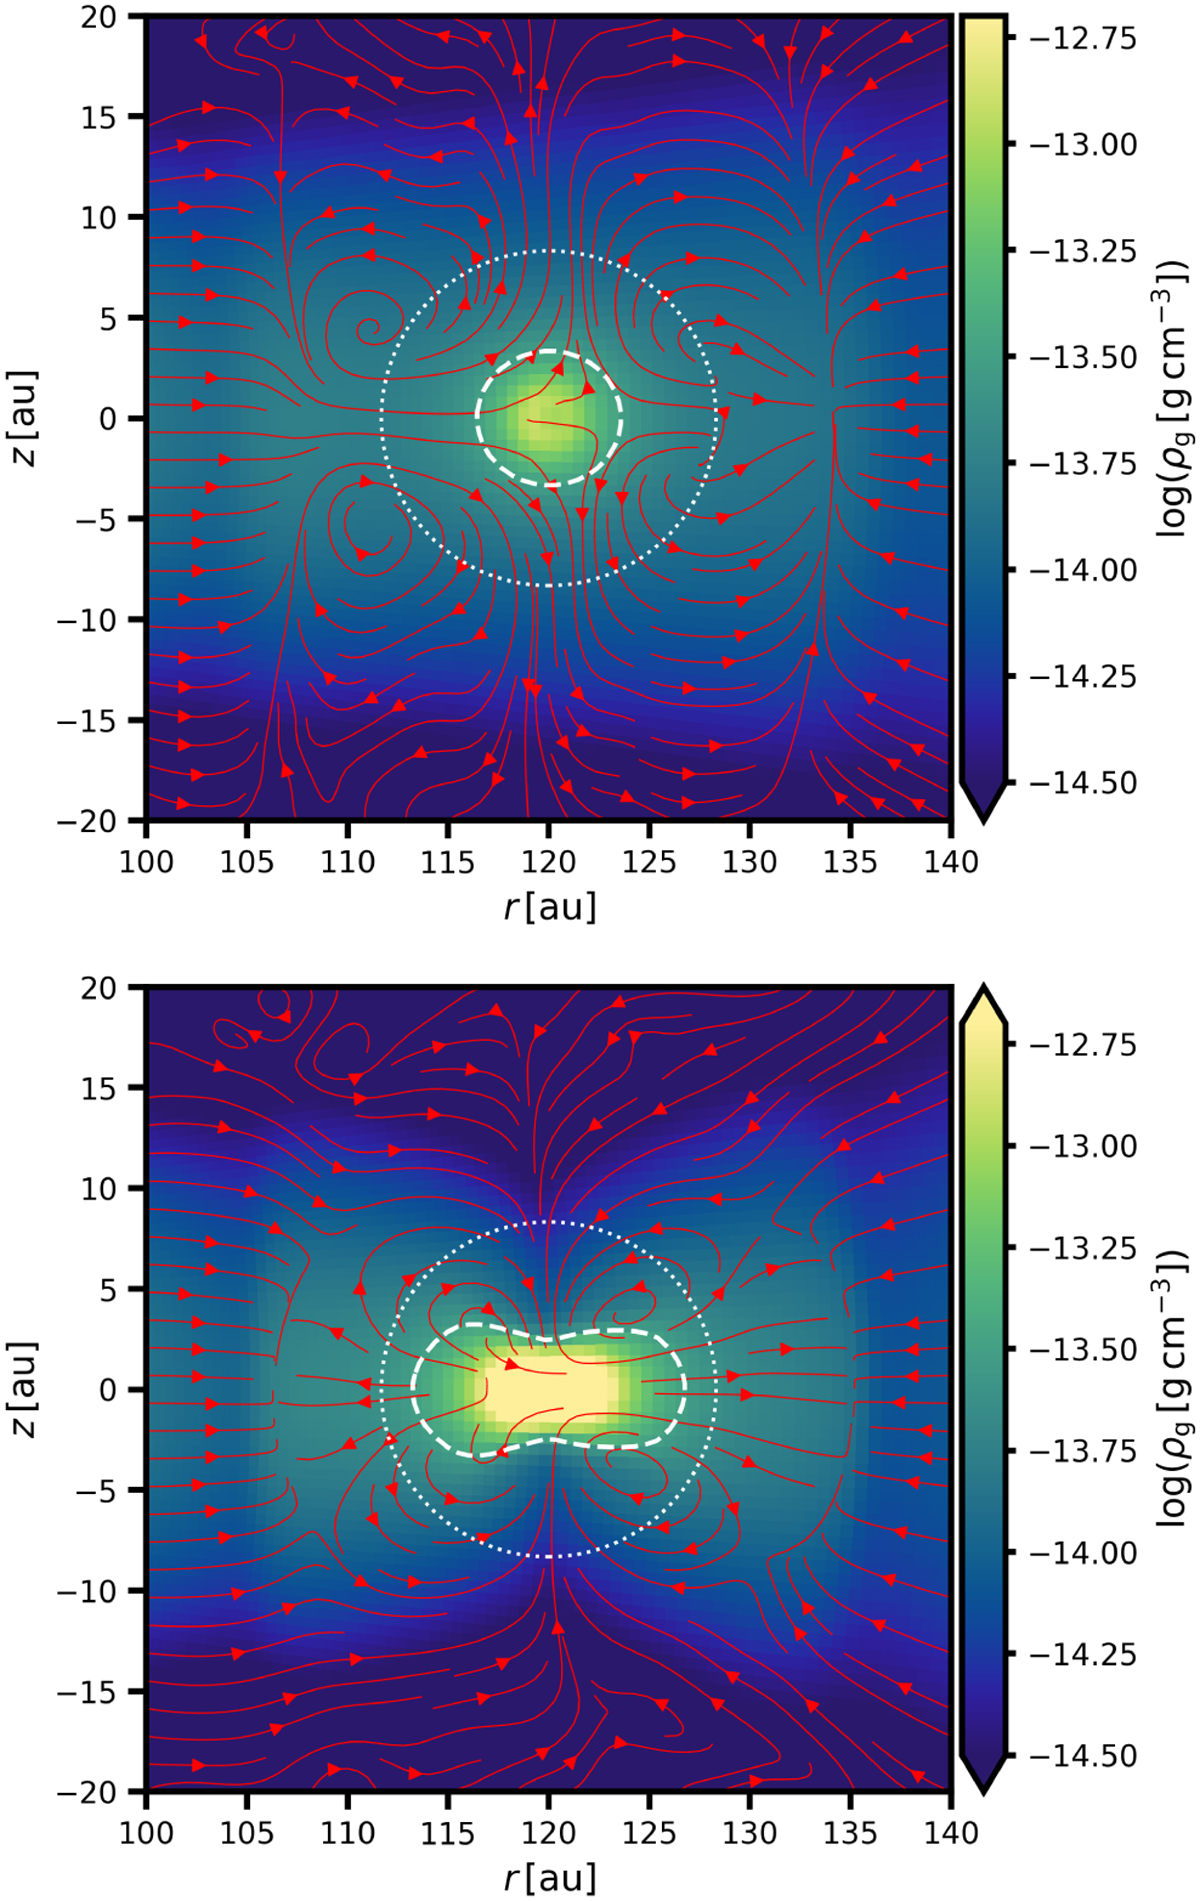
Logarithm of the vertical gas density distribution in the vicinity of the planet at t=375 orbits (the same orbital time as in Fig. 9). Overlaid are the streamlines of the gaseous meridional flow (red arrows), the Hill sphere (white dotted circle), and an arbitrarily chosen isosurface of log (ρg/g cm−3)=−13.5 (white dashed curve). Top: nominal simulation. Bottom: simulation Scold with a zero-luminosity planet.
Current usage metrics show cumulative count of Article Views (full-text article views including HTML views, PDF and ePub downloads, according to the available data) and Abstracts Views on Vision4Press platform.
Data correspond to usage on the plateform after 2015. The current usage metrics is available 48-96 hours after online publication and is updated daily on week days.
Initial download of the metrics may take a while.