Fig. 2
Download original image
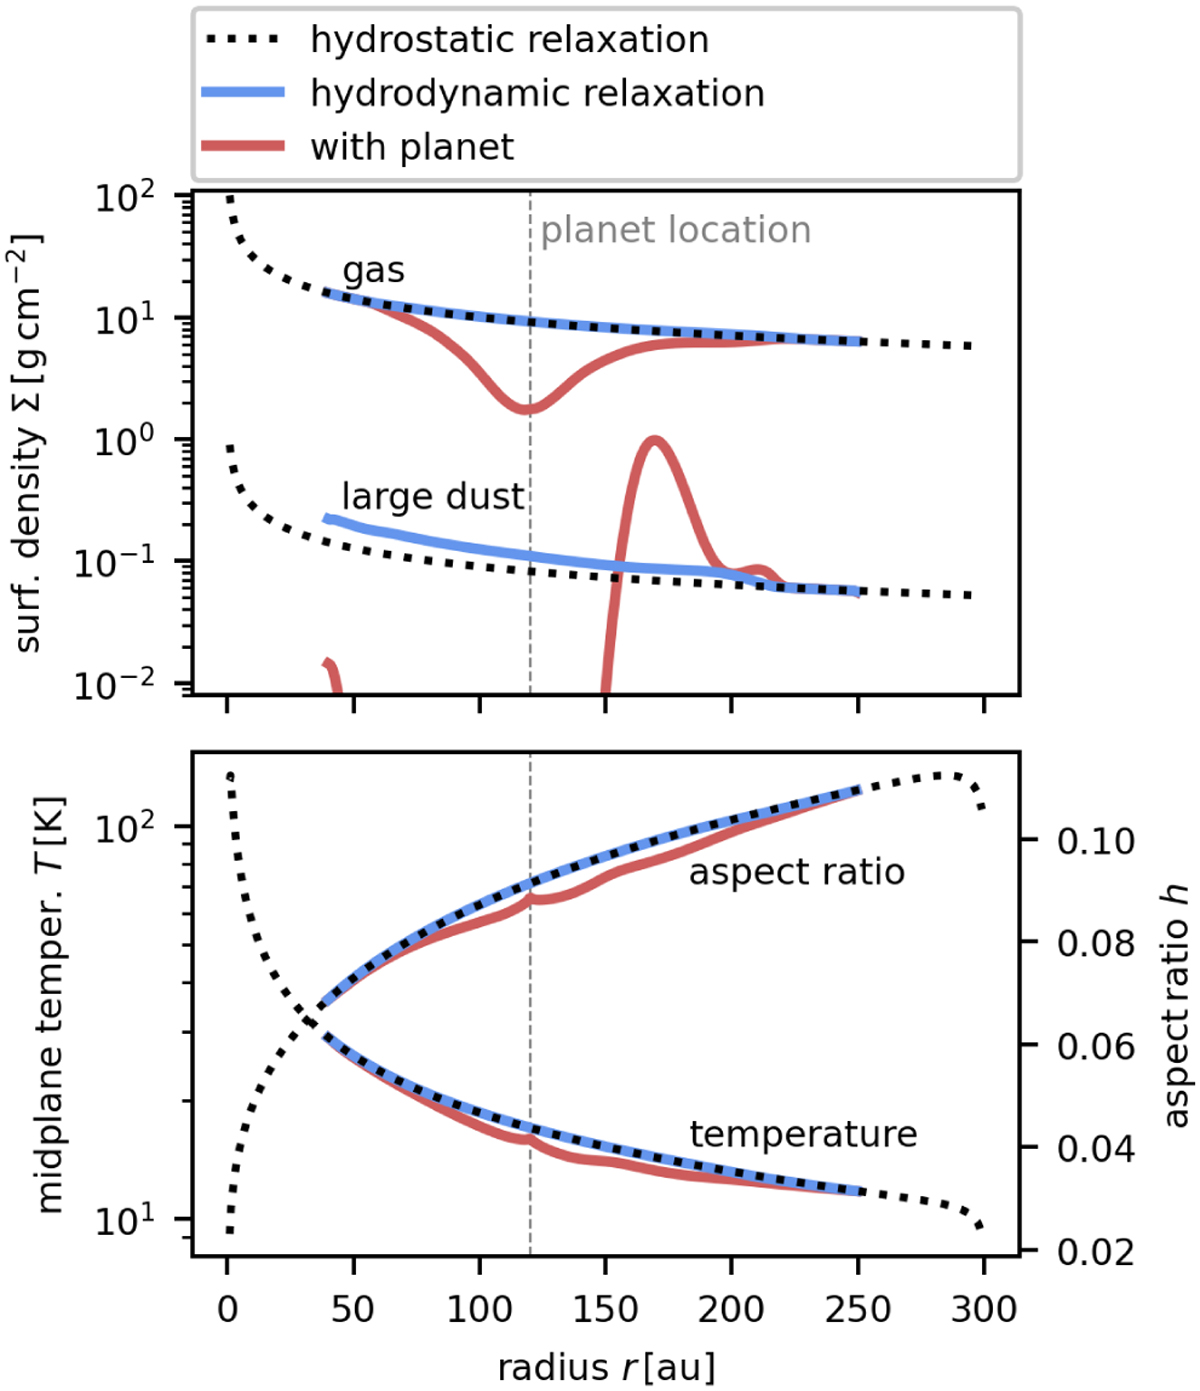
Azimuthally averaged radial profiles in our nominal simulation with a Jupiter-mass planet. Top: vertically integrated surface density of gas and large dust. Bottom: midplane temperature (primary vertical axis) and aspect ratio (secondary vertical axis). We show the final state after the hydrostatic relaxation (dotted black curve), the hydrodynamic relaxation (solid blue curve), and the main stage with the embedded planet (solid red curve). The planet location is marked with the dashed vertical line.
Current usage metrics show cumulative count of Article Views (full-text article views including HTML views, PDF and ePub downloads, according to the available data) and Abstracts Views on Vision4Press platform.
Data correspond to usage on the plateform after 2015. The current usage metrics is available 48-96 hours after online publication and is updated daily on week days.
Initial download of the metrics may take a while.