Fig. 9
Download original image
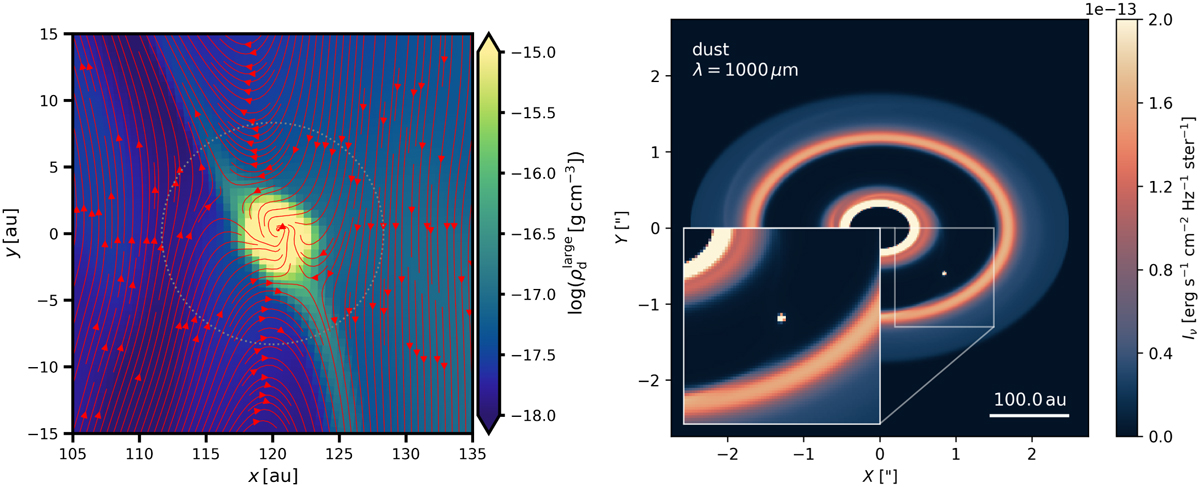
Left: logarithm of the midplane density of large dust ![]() in the vicinity of the planet at t=375 orbits. The dust streamlines (red arrows) and the Hill sphere of the planet (dotted gray circle) are overlaid. Dust leakage is apparent along the downstream horseshoe flow. Right: continuum emission of large dust grains at t=375 orbits, with a hot spot arising from the circumplanetary region. The extent of the color scale is the same as in panel d of Fig. 5 to enable a direct comparison.
in the vicinity of the planet at t=375 orbits. The dust streamlines (red arrows) and the Hill sphere of the planet (dotted gray circle) are overlaid. Dust leakage is apparent along the downstream horseshoe flow. Right: continuum emission of large dust grains at t=375 orbits, with a hot spot arising from the circumplanetary region. The extent of the color scale is the same as in panel d of Fig. 5 to enable a direct comparison.
Current usage metrics show cumulative count of Article Views (full-text article views including HTML views, PDF and ePub downloads, according to the available data) and Abstracts Views on Vision4Press platform.
Data correspond to usage on the plateform after 2015. The current usage metrics is available 48-96 hours after online publication and is updated daily on week days.
Initial download of the metrics may take a while.