Open Access
Fig. 11.
Download original image
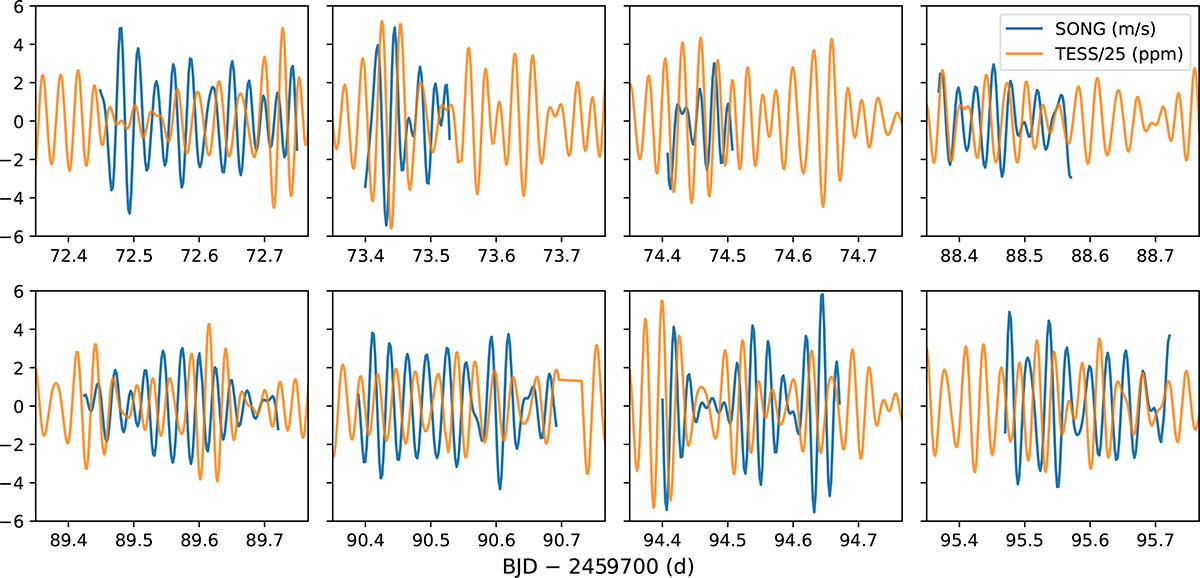
Observations of β Aql on eight nights that had overlap between SONG and TESS. Each panel shows a 10-h segment, with radial velocities from SONG-Tenerife in ms−1 (blue curves) and TESS photometry divided by 25 ppm (orange curves). Both series have been bandpass-filtered to show variations in the range 330–550 μHz.
Current usage metrics show cumulative count of Article Views (full-text article views including HTML views, PDF and ePub downloads, according to the available data) and Abstracts Views on Vision4Press platform.
Data correspond to usage on the plateform after 2015. The current usage metrics is available 48-96 hours after online publication and is updated daily on week days.
Initial download of the metrics may take a while.