Fig. 1
Download original image
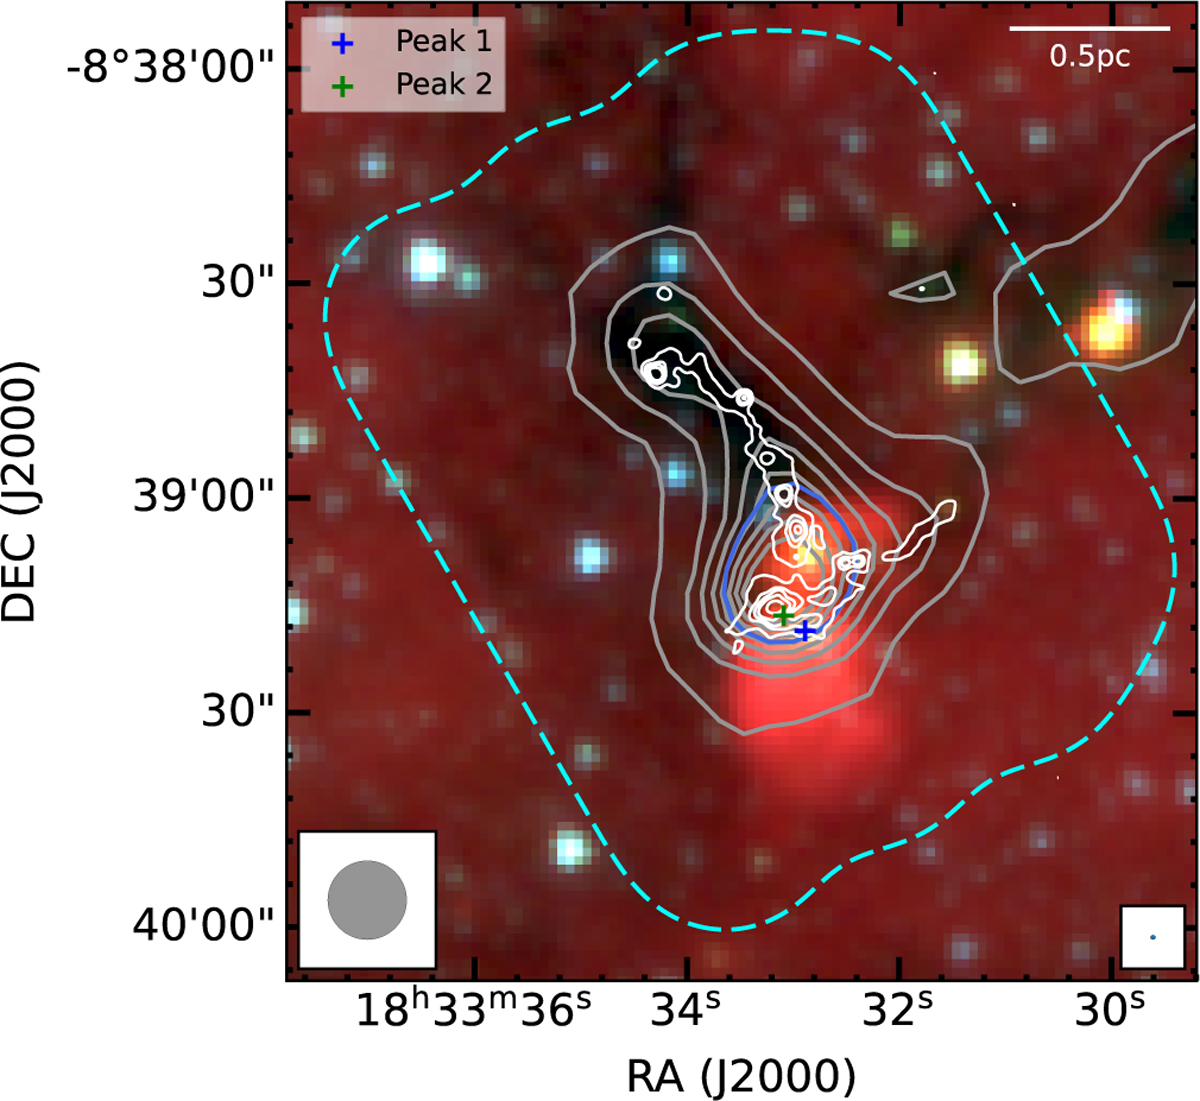
Presentation of I18308 cloud with three-color composite image, combining Spitzer 3.6 μm (blue), 4.5 μm (green), and 8.0 μm (red) emission. The dashed cyan loop outlines the ALMA mosaic field at 1.3 mm toward I18308. White contours depict 1.3 mm dust-emission intensities at [3, 9, 15, 27, 81, 243] × σ1.3 mm, where σ1.3 mm = 0.1 mJy beam-1. Gray contours show cold dust emission from the single-dish MAMBO survey at 1.2 mm, starting from 5σMAMBO in steps of 5σMAMBO, with 1σMAMBO ~ 11 mJy beam-1 (Beuther et al. 2002). The blue contour corresponds to a level of 25σMAMBO, encompassing the hub region. The blue and green crosses pinpoint the primary and secondary peaks of 1.3 cm free-free emission, respectively, typical of the (UC) H II regions (Lu et al. 2018). The synthesized beam sizes are 11″ × 11″ for the MAMBO observations and 0.71″ × 0.59″ for the ALMA ones, indicated in the lower left and right corners, respectively. A scale bar of 0.5 pc is shown in the top right corner.
Current usage metrics show cumulative count of Article Views (full-text article views including HTML views, PDF and ePub downloads, according to the available data) and Abstracts Views on Vision4Press platform.
Data correspond to usage on the plateform after 2015. The current usage metrics is available 48-96 hours after online publication and is updated daily on week days.
Initial download of the metrics may take a while.