| Issue |
A&A
Volume 700, August 2025
|
|
|---|---|---|
| Article Number | A47 | |
| Number of page(s) | 16 | |
| Section | Interstellar and circumstellar matter | |
| DOI | https://doi.org/10.1051/0004-6361/202554634 | |
| Published online | 04 August 2025 | |
Hierarchical fragmentation in hub-filament-system I18308 observed as part of the INFANT survey
1
School of Physics and Astronomy, Yunnan University,
Kunming
650091,
PR China
2
Shanghai Astronomical Observatory, Chinese Academy of Sciences,
80 Nandan Road,
Shanghai
200030,
PR China
3
State Key Laboratory of Radio Astronomy and Technology,
A20 Datun Road,
Chaoyang District,
Beijing
100101,
PR China
4
National Astronomical Observatory of Japan,
2-21-1 Osawa,
Mitaka,
Tokyo
181-8588,
Japan
5
Instituto de Radioastronomía y Astrofísica, Universidad Nacional Autónoma de México,
Morelia,
Michoacán
58089,
Mexico
6
Department of Physics, National Sun Yat-Sen University,
No. 70, Lien-Hai Road,
Kaohsiung City
80424,
Taiwan,
ROC
7
Department of Astronomy, The University of Tokyo,
Hongo,
Tokyo
113-0033,
Japan
8
The Graduate University for Advanced Studies (SOKENDAI),
2-21-1 Osawa,
Mitaka,
Tokyo
181-8588,
Japan
9
National Astronomical Observatories, Chinese Academy of Sciences,
Beijing
100101,
PR China
10
Max Planck Institute for Astronomy,
Konigstuhl 17,
69117
Heidelberg,
Germany
11
Department of Astronomy, Xiamen University,
Zengcuo’an West Road,
Xiamen
361005,
PR China
12
Center for Astrophysics, Harvard & Smithsonian,
MS-42, 60 Garden Street,
Cambridge,
MA
02138,
USA
13
Kavli Institute for Astronomy and Astrophysics, Peking University,
Beijing
100871,
PR China
14
Max-Planck-Institut für Extraterrestrische Physik,
Giessenbachstr. 1,
85748
Garching bei München,
Germany
15
School of Astronomy and Space Science, Nanjing University,
163 Xianlin Avenue,
Nanjing
210023,
PR China
16
Key Laboratory of Modern Astronomy and Astrophysics (Nanjing University), Ministry of Education,
Nanjing
210023,
PR China
17
Department of Earth and Planetary Sciences, Institute of Science Tokyo,
Meguro,
Tokyo
152-8551,
Japan
18
Joint Alma Observatory (JAO),
Alonso de Córdova 3107,
Vitacura,
Santiago,
Chile
★★ Corresponding authors: This email address is being protected from spambots. You need JavaScript enabled to view it.
; This email address is being protected from spambots. You need JavaScript enabled to view it.
; This email address is being protected from spambots. You need JavaScript enabled to view it.
Received:
19
March
2025
Accepted:
4
June
2025
Abstract
Context. There is increasing evidence of a physical link between high-mass star formation and hub-filament systems (HFSs). However, a lack of multi-scale observations of HFS clouds hinders our understanding of the detailed and scale-dependent cloud fragmentation and associated dynamical high-mass star formation.
Aims. This study aims to understand the multi-scale scenario of cloud fragmentation and associated high-mass star formation in an HFS cloud.
Methods. As part of the ALMA-INFANT survey, we used 1.3 mm mosaic observations of the high-mass star-forming HFS cloud I18308 at a spatial resolution of ~3000 AU, which provided multiscale information on the HFS. We analyzed the filament and hub fragmentation properties (e.g., core separation and mass).
Results. The I18308 cloud exhibits a well-defined HFS morphology in ALMA 1.3 mm continuum with two filaments (F1 and F2) converging toward the central hub. Eighteen compact cores are identified: nine in the hub, six in F1, and three in F2. Most cores are gravitationally bound and have high-mass surface densities of >1 g cm-2, indicating their potential for high-mass star formation, especially in the hub, which already hosts an embedded UCH II region. The scale-dependent fragmentation is characterized by a cylindrical mode for F1 and F2, and a nearly-spherical Jeans-like mode for the central clumpy hub. This could be attributed to the (an)isotropic evolution of larger scale density structures into smaller scale ones. Additionally, the scale-dependent fragmentation mechanisms are identified as turbulence-driven within the filaments and gravity-driven inside the central hub. No candidate high-mass prestellar cores (>30 M⊙) are observed across the whole cloud. In the hub, protostellar cores have higher average mass, surface density, and temperature; and smaller radius than prestellar cores, which is consistent with continuous mass accumulation during evolution.
Conclusions. The well-defined HFS morphology, the absence of high-mass prestellar cores, and the increasing core mass and surface density with evolutionary stage collectively suggest a multi-scale dynamical scenario of mass accumulation for high-mass star formation in I18308.
Key words: stars: formation / ISM: clouds / ISM: individual objects: I18308
These authors contributed equally to this work.
© The Authors 2025
 Open Access article, published by EDP Sciences, under the terms of the Creative Commons Attribution License (https://creativecommons.org/licenses/by/4.0), which permits unrestricted use, distribution, and reproduction in any medium, provided the original work is properly cited.
This article is published in open access under the Subscribe to Open model. This email address is being protected from spambots. You need JavaScript enabled to view it. to support open access publication.
1 Introduction
Filamentary structures are found to be ubiquitous within the interstellar medium (e.g., Molinari et al. 2010; André et al. 2010, 2019; Yuan et al. 2021; Hacar et al. 2023), playing a crucial role in initiating star formation in both low- and high-mass environments. Intersections of filaments can create complex networks where several filaments converge on a central node. These structures, termed hub-filament systems (HFSs), represent a distinct class of filamentary configurations that are particularly relevant for high-mass star formation (e.g., Myers 2009; Liu et al. 2012; Galván-Madrid et al. 2013; Kumar et al. 2020; Morii et al. 2023; Dewangan et al. 2025; Shen et al. 2024). Within an HFS, the central node, or “hub”, typically exhibits a lower aspect ratio and higher column density compared to the individual filaments that converge upon it, which often display higher aspect ratios and lower column densities (e.g., Myers 2009; Kumar et al. 2020; Liu et al. 2023; Hacar et al. 2025).
High-mass star formation within the intricate architecture of HFSs remains an area of active research. Two prominent theoretical frameworks, global hierarchical collapse (GHC) (Vázquez-Semadeni et al. 2019) and inertial inflow (I2) (Padoan et al. 2020), offer potential perspectives on the high-mass star formation scenario in HFSs. Both models successfully reproduce the observed HFS morphology and emphasize the importance of multi-scale mass transport within these systems. HFSs facilitate the efficient transfer of material from large-scale cloud structures through a network of filaments to the central hub, where high-mass star formation preferentially occurs (e.g., Kumar et al. 2020; Saha et al. 2022; Liu et al. 2023; He et al. 2023). However, these models diverge in their primary drivers of mass accretion. GHC posits gravity as the dominant force across all scales, while I2 favors turbulence as the primary driver on large scales (e.g., Luo et al. 2024b,a, 2025); that is, within filaments and the molecular cloud itself (e.g., Pan et al. 2024).
Fragmentation is pivotal for star formation. HFSs exhibit a hierarchical structure with density variations across multiple scales, which could lead to a multi-scale fragmentation (e.g., Kainulainen et al. 2013, 2017). This multi-scale fragmentation likely regulates the final stellar masses. Filaments within HFSs typically fragment according to the cylindrical mode, often compared to the classical cylindrical fragmentation model (e.g., Chandrasekhar & Fermi 1953; Nagasawa 1987). Observed core separations within filaments often deviate from the predictions of this model (e.g., André et al. 2014; Könyves et al. 2020), although a few good examples of quasi-periodic chains of dense cores have been reported (e.g., Tafalla & Hacar 2015; Liu et al. 2019b; Zhang et al. 2020). In contrast, the central massive hub within an HFS displays a clumpy structure, suggesting fragmentation via a spherical Jeans-like mode, potentially driven by thermal or turbulent instabilities (e.g., Wang et al. 2014; Beuther et al. 2018; Palau et al. 2014). To advance our understanding of high-mass star formation within HFSs, it is essential to analyze fragmentation across all relevant scales, considering both filament and hub fragmentation processes.
The targeted source of this paper is the IRAS 18308-0841 (hereafter I18308). Located at 4.6 ± 0.5 kpc1 (Lu et al. 2014; Cheng et al. 2024), this filamentary infrared dark cloud (IRDC) with IR bright emission at 8 μm at one of its ends (Fig. 1) can be identified from other single-dish observations such as the MAMBO 1.2 mm continuum observations (Beuther et al. 2002). The cloud’s overall properties, including a luminosity of ~2.5 × 10⁴ L⊙ and a mass of ~2.7 × 10³ M⊙ with a size of 1.5 pc, have been estimated from both single-dish and interferometric observations (Lu et al. 2014, 2018; Cheng et al. 2024). In addition, the I18308 contains a well-defined HFS structure characterized by converging filaments toward a central hub, which was first revealed in the Very Large Array (VLA) NH3 observations with a beam size of 5″ × 3″ (Lu et al. 2014). The northern filament in this HFS is mostly IR-dark in 8 μm emission, suggesting that the entire HFS I18308 cloud is still in the early stages of star formation. The identification of nine dense cores, some of which have masses exceeding 100 M⊙ within ~0.1 pc (Lu et al. 2018), highlights the potential for massive star formation within this cloud. This agrees with the presence of a cometary ultra-compact (UC) H II region in the hub. Along with the IRDC nature, these observed facts suggest that the HFS I18308 cloud is an ideal laboratory for studying the connection between HFSs and high-mass star formation in its early stages.
This work was aimed at further our understanding of the complete fragmentation scenario across multiple scales within the I18308 HFS. By analyzing fragmentation processes within both filaments and the central hub, we intend to gain insights into the multi-scale dynamical processes driving high-mass star formation in this system. The paper is organized as follows: Section 2 presents the observational data; Section 3 describes the analysis and results; Section 4 discusses the fragmentation modes in filaments and the central hub and explores the implications for high-mass star formation within the I18308 HFS; and Section 5 summarizes our major findings.
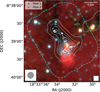 |
Fig. 1 Presentation of I18308 cloud with three-color composite image, combining Spitzer 3.6 μm (blue), 4.5 μm (green), and 8.0 μm (red) emission. The dashed cyan loop outlines the ALMA mosaic field at 1.3 mm toward I18308. White contours depict 1.3 mm dust-emission intensities at [3, 9, 15, 27, 81, 243] × σ1.3 mm, where σ1.3 mm = 0.1 mJy beam-1. Gray contours show cold dust emission from the single-dish MAMBO survey at 1.2 mm, starting from 5σMAMBO in steps of 5σMAMBO, with 1σMAMBO ~ 11 mJy beam-1 (Beuther et al. 2002). The blue contour corresponds to a level of 25σMAMBO, encompassing the hub region. The blue and green crosses pinpoint the primary and secondary peaks of 1.3 cm free-free emission, respectively, typical of the (UC) H II regions (Lu et al. 2018). The synthesized beam sizes are 11″ × 11″ for the MAMBO observations and 0.71″ × 0.59″ for the ALMA ones, indicated in the lower left and right corners, respectively. A scale bar of 0.5 pc is shown in the top right corner. |
2 Observations
The HFS cloud, I18308, was observed as part of the INvestigations of massive Filaments ANd sTar formation (INFANT) survey (Cheng et al. 2024). The observations were conducted at 1.3 mm using the Atacama Large Millimeter Array (ALMA) in cycle 5 (Project ID 2017.1.00526.S,PI: X. Lu) between March and August, 2018. The I18308 cloud was covered by 40 mosaic fields using the C43-1 and C43-4 array configurations. The observations have a maximum recoverable scale of 12″.4. We primarily made use of the continuum data of the survey. The 1.3 mm continuum data have a synthesized beam size of 0.71″ × 0.59″ (~3000 AU at the source distance) and a sensitivity of ~0.12mJy beam-1 (0.08 M⊙ at a 15K dust temperature). The INFANT survey also observed line emission of major species at 1.3 mm such as H2CO (30,3 - 20,2), H2CO (32,2 - 22,1), H2CO (32,1 - 22,0), SiO (5-4), CO (2- 1), and N2D+ (3 -2), with a channel spacing of 0.63-0.67 km s-1. Details on observations and data reduction can be found in Cheng et al. (2024).
Moreover, the ALMA observations without the total power observing mode have an insufficient maximum recoverable scale for our filament-scale analysis. Following Barnes et al. (2019), we therefore used the “feathering” technique to combine the MAMBO 1.2 mm continuum image (accounting for the frequency difference) and the ALMA image. The final combined (feathered) continuum image has recovered about 96% of the total flux measured by the MAMBO image over the effective area that is bounded within a level of pblimit = 0.3 by the ALMA observations.
We utilized the Very Large Array (VLA) NH3 observations from Cheng et al. (2024) for core kinematic analysis, achieving an rms of 1.3-1.5 mJy beam-1 per 0.4 km s-1 spectral resolution with a beam size of 1.3″ × 0.9″. We additionally used VLA NH3 (1-1) data from Lu et al. (2014) for a largescale kinematic analysis, with an rms of 2-3 mJy beam-1 per 0.62 km s-1 spectral resolution and a beam size of 5″ × 3″. Details on observations can be found in Cheng et al. (2024) and Lu et al. (2014). Furthermore, Spitzer 3.6, 4.5, and 8.0 μm images from the Galactic Legacy Infrared Midplane Survey Extraordinaire survey (GLIMPSE; Benjamin et al. 2003) were used to identify the HFS cloud morphology of I18308 (Fig. 1). These images have angular resolutions better than 2″ (Benjamin et al. 2003).
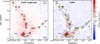 |
Fig. 2 Left: combined (feathered) ALMA 1.3 mm continuum map of I18308. Eighteen cores c1-c18 are marked with their FWHM ellipses. Five extended fragments (f1-f5) are marked with the green diamonds. The dashed gray contour outlines the 2σ1.3 mm boundary of three hierarchical regions: F1, F2, and the hub. The blue and green crosses mark the locations of the compact peak (Peak 1) and secondary peak (Peak 2) in the (UC) H II region detected by the VLA 1.3 cm (Lu et al. 2018). Right: ALMA 1.3 mm continuum map of I18308. The black contours are at [5, 10, 20, 40, 80, 160] × σ1.3 mm (σ1.3 mm = 0.1 mJy beam-1). The dashed black contour outlines the 2σ1.3 mm boundary of three hierarchical regions: F1, F2, and the hub. Green stars and blue crosses indicate protostellar and prestellar cores, respectively. Green diamonds indicate additional extended fragments. The synthesized beam and a 0.1 pc scale bar are shown in the lower left and lower right corners, respectively. |
3 Results and analysis
3.1 Hierarchical structures in the HFS cloud seen in ALMA observations
3.1.1 Identification of filaments and hub
Figure 2 (left panel) presents the combined (feathered) 1.3 mm continuum image showing a prominent HFS structure. Two filaments, Filament 1 (F1, northeast-southwest) and Filament 2 (F2, northwest-southeast), appear to spatially converge onto a central clumpy hub. The 2σ1.3 mm contour (i.e., outermost dashed contour in Fig. 2 and σ1.3 mm = 0.1 mJy beam-1) delineates these hierarchical structures. We manually outlined the boundary of the F1 and F2 filaments and the hub, as shown in Figure 2. NH3 (1-1) line emission (Fig. A) shows a coherent velocity distribution within these boundaries, indicating the nature of the individual velocity-coherent structures for F1, F2, and the hub within I18308. Based on the boundaries of these structures, we extracted the total integrated flux (Fν) over their area (A) from the combined ALMA 1.3 mm continuum image. In addition, the length (LF) of the filaments was measured along their crest, corresponding to the connection of positions with the highest 1.3 mm intensity. Accordingly, the effective width (WF) of the filaments was estimated by A/LF assuming a rectangular morphology. Likewise, the effective radius (RH) of the central clumpy hub was approximated as  . All parameters listed above for the three density structures are shown in Table 1.
As shown in Figure 1, most of F1 is IR-dark, implying a nature of relatively quiescent star formation therein. In contrast, F2 is mostly IR-bright, suggesting that this filament can be influenced by nearby active star formation toward the central hub. The central clumpy hub is fully embedded in rather bright 8.0 μm emission, which corresponds to the region of the most intensive star-forming activity within I18308 as characterized by the presence of the (UC) H II regions centered at the hub (i.e., the blue and green crosses in Figs. 1 and 2).
Parameters of hierarchical structures in I18308.
Observed and derived parameters of dense cores.
3.1.2 Core and fragment identification
Using ALMA 1.3 mm continuum data, Cheng et al. (2024) identified 22 compact cores in I18308 with the getsf algorithm. Getsf distinguishes compact sources and elongated filaments in astronomical images by separating multi-scale structural components from the background (Men’shchikov 2021). Among the 22 cores, four (N-c1 to N-c4) are located in the northern region that appears not to belong to the HFS (Fig. B); they are thus not shown in Fig. 2. Therefore, they are not analyzed in the following. The measured parameters of the cores in question by the algorithm are listed in Table 2, including the coordinates, size, and 1.3 mm integrated flux. Moreover, following the earlier works of Sanhueza et al. (2019) and Li et al. (2022), these cores were classified by Cheng et al. (2024) as protostellar candidates if associated with molecular outflows and/or warm gas tracers(H2CO(32,2-22,1),(32,1-22,0),andCH3OH(42,2-31,2)), or prestellar candidates otherwise (see details in Appendix C). Table 2 shows a total of 12 protostellar and six prestellar cores in the I18308 HFS cloud. Specifically, there are three prestellar and six protostellar cores in the hub, three prestellar and three protostellar cores in F1, and three protostellar cores in F2.
The getsf algorithm (Men’shchikov 2021) missed several extended, relatively weak 1.3 mm emission regions that likely represent fragments as a product of the I18308 cloud fragmentation. To recover them, we employed the widely-used astrodendro algorithm (Ginsburg et al. 2016), which identifies hierarchical density structures from the 1.3 mm continuum map. Cheng et al. (2024) compared getsf and astrodendro, concluding that while getsf excels in identifying compact, emission-bright cores, astrodendro is better suited for extended and emission-weak structures. Therefore, combining both methods can provide a relatively comprehensive catalog of cores and fragments. Using astrodendro, we identified five new fragments (diamonds in Fig. 2), whose measured parameters by the algorithm can be found in Table B, including the coordinates, size, and 1.3 mm integrated flux. Details on the identification process are provided in Appendix B.
Note that the integrated flux of cores and fragments was measured using the ALMA continuum data alone. On one hand, those data already provide a sufficient maximum recoverable scale to capture the majority of the flux for compact sources. On the other hand, the getsf algorithm’s ability to effectively remove background emission (Men’shchikov 2021)-where compact sources are embedded-enables it to produce comparable flux measurements for these sources, whether using the ALMA data alone or the feathered dataset.
3.2 Derived parameters of hierarchical structures
3.2.1 Parameters of filaments and hub
The mass of the filaments and hub in I18308 was calculated following the gray-body radiative transfer equation in an optically thin condition (e.g., Hildebrand 1983):
 (1)
(1)
where Fν is the 1.3 mm flux density measured from the feathered 1.3 mm continuum image; the gas-to-dust mass ratio, Rgd, is taken as Rgd = 100 (Bohlin et al. 1978); d is the source distance; Bv(Td) is the Planck function for the dust temperature, Td; and κν is the dust opacity at the observed frequency, ν. We adopted κ1.3 mm = 0.899 cm-2 g-1, corresponding to conditions at a density of 106 cm-3 for thin ice mantles (Ossenkopf & Henning 1994). Assuming a local thermal equilibrium (LTE) condition, Td can be treated as the gas temperature, Tg. Accordingly, we estimated Tg for all hierarchical structures from the NH3 rotational temperature map (see Fig. A in Appendix A; Lu et al. 2018) by taking the mean value over their boundary. Furthermore, we estimated the mass surface density (Σ) of the filaments and hub via  .
.
The parameters derived above are presented in Table 1. The uncertainties of these parameters come from various aspects. The first one is a kinematic distance uncertainty of 10%, which caused uncertainties for the scale (i.e., LF or RH) and area (A) parameters of the F1-2 filaments and the hub. Additionally, the κν and Rgd parameters can vary across different clouds, ranging from diffuse to dense environments (e.g., Martin et al. 2012; Roy et al. 2013; Webb et al. 2017). We adopted uncertainties of 23% and 28% for Rgd and κν, respectively (e.g., Sanhueza et al. 2017; Xu et al. 2024; Shen et al. 2024). To account for the uncertainties mentioned above, we assumed a uniform distribution between the extreme values. By employing the Monte Carlo technique with 10 000 random samples, We considered 16% as the lower bound of uncertainty and 84% as the upper bound, which represent the final uncertainties of the parameter. Specifically, the Monte Carlo approach was utilized for the uncertainty estimation of the mass and mass surface density as listed in Columns 4, 7, and 10 of Table 1.
Table 1 shows that the F1 and F2 filaments have average temperatures and gas masses of ~ 16.7 K and ~171 M⊙; and ~17.8 K and ~51 M⊙, respectively. The hub region exhibits an average temperature of ~ 20.7 K and a gas mass of ~185 M⊙. The mass surface density is ~0.4-0.6 g cm-2 in the F1 and F2 filaments, it is ~0.6 g cm-2 in the hub region. It is worth noting that while the average mass surface densities over F1 and F2 are not distinguishable, the local enhancement of this parameter appears relatively more evident in F1, suggesting that F1 is denser than F2 in the densest regions; for example, those encompassed by a contour of 20 σ1.3 mm (see Fig. 2).
Figure 3 shows the distribution of mass versus mass surface density for the hub and two filaments. Their surface densities significantly exceed an empirical threshold of 0.05 g cm-2 for high-mass star formation, established based on ATLASGAL massive clumps exhibiting high-mass star formation signatures (Urquhart et al. 2014). This suggests that the entire HFS I18308 cloud, especially the central hub, possesses a sufficient density for high-mass star formation to occur.
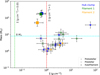 |
Fig. 3 Surface density versus core masses. Stars and crosses indicate protostellar and prestellar cores, respectively. Squares denote the F1 and F2 filaments and the hub. Orange represents F2, green represents F1, blue represents the hub clump. Green and red vertical lines indicate surface density thresholds of 0.05 g cm-2 (Urquhart et al. 2014) and 1 g cm-2 (Krumholz & McKee 2008), respectively, while the horizontal line denotes a core mass of 8 M⊙. |
3.2.2 Parameters of cores and fragments
The masses of 18 compact cores were calculated in Cheng et al. (2024) following the same approach as in Eq. (1), and therefore were adopted here. Assuming a spherical morphology for all cores and fragments, the deconvolved core radii (R) were estimated from the geometric mean of the full width at half maximum (FWHM) sizes. Core mass surface densities were computed using  . Average H2 number densities (nH2) of cores were estimated as follows:
 (2)
(2)
where μ is the molecular weight per hydrogen molecule (2.8, Kauffmann et al. 2008) and mH is the mass of a hydrogen atom. Likewise, for the five relatively extended fragments, the M, Σ(H2), and n(H2) parameters were estimated (see Table B). The Monte Carlo method (Sect. 3.2.1) was used to estimate uncertainties for the parameters derived above (Tables 2 and B).
The cores in the HFS I18308 cloud have masses in the range of [1.0, 37.6] M⊙ with a median of 3.0 M⊙, surface densities in the range of [0.6, 61.6] g cm-2 with a median of 2.8 gcm-2, and number densities in the range of [0.1, 50.2] × 107 cm-3 with a median of 1.4 ×107 cm-3. Figure3 shows that 83% of cores exceed a density of 1 g cm-2, the empirical threshold for highmass star formation (Krumholz & McKee 2008), indicating the potential for high-mass star formation. In particular, the C3 core, with the highest mass surface density of around 62g cm-2 and a gas mass of around 38 M⊙, is located near the (UC) H II region typical of a high-mass star formation signature (see left map of Fig. 2).
The five fragments have masses in the range of [1.6, 2.2] M⊙ with a median of 2.0 M⊙ and number densities in the range of [3.2, 7.6] ×106 cm-3 with a median of 6.2 ×106 cm-3. These results indicate that the fragments investigated here are about an order of magnitude less dense than the compact cores. This is consistent with an average aspect ratio of 2.7 for the five fragments (Table B), corresponding to a more extended morphology compared to the compact cores. We therefore suggest that these relatively extended fragments may not undergo star formation in any subsequent evolution. However, as part of the products of the I18308 cloud’s fragmentation process, they are considered in our cloud fragmentation analysis (Sect. 3.4).
3.3 Kinematic analysis of density structures
3.3.1 Stability of the filament and hub
The observed line mass ( ), in conjunction with the critical line mass (
 ), is a standard tool for assessing the dynamical stability of a filament. The critical line mass for an unmagnetized isothermal filament is (Inutsuka & Miyama 1997; Wang et al. 2014)
 (3)
(3)
where G is the gravitational constant and σeff is the effective speed of sound.
σeff can be either σth for thermal motions or σtot for thermal and turbulent motions. For F1 and F2, thermal motions alone yield ~30 M⊙ pc-1 (Table 3). Including turbulent motions, the total velocity dispersions of 0.38 km s-1 and 0.50 km s-1 for F1 and F2, respectively, lead to ~67 M⊙ pc-1 and ~116 M⊙ pc-1. Here, the total velocity dispersions were estimated from the linewidth map of NH3 observations (Lu et al. 2018) by taking the median over each filament (see Fig. A), following the method described in Section 3.3.2. Comparing  and
and  in Table 3, we find that F1 is supercritical even with turbulent support, indicating a gravitationally bound state. This remains robust within uncertainties, as
  for F1 significantly exceeds
  . This finding agrees with the result of Lu et al. (2018) for the same analysis, but instead using Submillimeter Array (SMA) observations at a 3″ angular resolution. F2, however, is uncertain due to a large error in
  , which is possibly in a trans-critical or subcritical state within uncertainties.
Given its higher velocity dispersion than in F1 and the IR-bright environment, F2 is more likely subcritical and possibly being dispersed for part of the filament due to feedback from surrounding star formation (see IR-bright feature near F2 in Fig. 1), which is consistent with the presence of only a few dense cores and a large extent of relatively diffuse emission within this filament.
To assess the dynamical stability of the central clumpy hub, we performed a virial analysis. According to Bertoldi & McKee (1992) and Liu et al. (2022), the virial mass of a dense clump is
 (4)
(4)
where σtot is the total velocity dispersion and Reff is the effective radius, assuming a spherical hub clump (Table 1). From the NH3 (1-1) line-width map (Fig. A in Appendix A), we measured an observed velocity dispersion of σNH3,obs ~ 0.62 km s-1, yielding a derived σtot of ~0.61 km s-1 (see Sect. 3.3.2 for details). Note that we did not utilize the new ALMA observations of optically thin lines (e.g., H2CO (32,2 - 22,1)) due to their low detection rates across the majority of the region.
The virial mass for the clumpy hub can be compared to the observed mass through the virial parameter:
 (5)
(5)
A sub-virial source with αvir < 2 will collapse, while a super-virial source with αvir > 2 will expand or require additional forces in order not to expand (e.g., magnetic fields or external pressure; Kauffmann et al. (2013). For the clumpy hub, we obtained a virial parameter of  (Table 1). This value is substantially lower than two within uncertainties, indicating a gravitationally bound state and thus the potential to collapse toward star formation. This is consistent with the ongoing star formation signatures in the central hub, such as the UC H II region.
Properties of filaments.
3.3.2 Stability of cores
To evaluate the dynamical stability of cores in I18308 using Eqs. (4)-(5), we first addressed the total velocity dispersion σtot. This parameter includes both thermal (σth) and nonthermal components (σnth):
 (6)
(6)
The thermal sound speed σth follows
 (7)
(7)
where kB is the Boltzmann’s constant. The gas kinematic temperature Tkin is taken as the NH3 rotation temperature, since both have been suggested to trace approximately the same thermal state for molecular gas typically below 30 K (Lu et al. 2014). μp = 2.33 is the mean molecular weight per free particle, assuming 90% for H and 10% for He in abundance.
The nonthermal velocity dispersion, σnth, inferred from the observed NH3 velocity dispersion is
 (8)
(8)
where μNH3 = 17. The deconvolved velocity dispersion of NH3 lines is
 (9)
(9)
where Vres is a spectral resolution of 0.4 km s-1 of NH3 observations from Cheng et al. (2024) for core kinematic analysis (e.g., Sect. 3.3.2) and 0.62 km s-1 from Lu et al. (2018) for large-scale filament kinematic analysis (e.g., Sect. 3.3.1).
Table 2 lists the estimated total velocity dispersion of these cores. Using Eqs. (4)-(5), we calculated the αvir parameter for all cores in I18308 (Table 2). In total, we find that nine of the 12 protostellar cores have a virial parameter of αvir < 2, indicating gravitationally bound states; three of the protostellar cores (c5-c7) within the hub have a virial parameter of αvir > 2, indicating a gravitationally unbound state. Particularly, four of the six prestellar cores are found to have virial parameters of αvir < 2, indicating gravitationally bound states; two of the prestellar cores (c2 and c4) within the hub have virial parameters of αvir > 2, indicating gravitationally unbound states. These two prestellar cores have an average total velocity dispersion of -0.81 kms-1, showing higher dispersion than in the remaining four (~0.44 km s-1). This suggests that the two supervirial cores could be more influenced by active star formation in the hub (see the left panel of Fig. 2). Note that the above analysis would change-but not significantly-when accounting for uncertainties on the αvir parameter.
3.4 Fragmentation in the HFS cloud
3.4.1 Core separations in the HFS cloud
The fragmentation characteristics of a cloud can be imprinted on the spatial separation of its substructures. We applied the minimum spanning tree (MST) method (Gower & Ross 1969)) to derive core separations in I18308. The MST generates a set of straight lines connecting a set of nodes, minimizing the sum of their lengths. Here, the nodes are core locations. Figure 4 and Table 1 show the MST analysis results. We observed a median core spacing of -0.07 ± 0.05 pc in F1, -0.10 ± 0.03 pc in F2, and -0.04 ± 0.01 pc in the central hub clump. To correct for the projection effect from the 3D space to the 2D plane, we divided the edge lengths by a factor of 2/π to estimate the deprojected separations (Sanhueza et al. 2019; Lu et al. 2020; Saha et al. 2022; Das et al. 2024). We estimated deprojected core separations of -0.11 ± 0.08 pc in F1, -0.14 ± 0.05 pc in F2, and -0.06 ± 0.02 pc in the central hub clump.
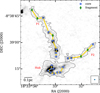 |
Fig. 4 Spatial distribution of core spacing in I18308. The background shows the ALMA 1.3 mm continuum image. The boundary of the F1, F2, and hub regions is the same as in Fig. 2. Blue dots mark core locations, while green diamonds represent fragments. The solid yellow line denotes the minimum path connecting these elements, given by the MST algorithm (see Sect. 3.4.1). The synthesized beam of 0.71″ × 0.59″ and a 0.1 pc scale bar are shown in the lower left and lower right corners, respectively. |
3.4.2 Filament fragmentation
According to the classical “sausage” instability model for a self-gravitating fluid cylinder (Chandrasekhar & Fermi 1953; Nagasawa 1987), cores formed through filament fragmentation will have a spacing approximately equal to the critical wavelength of the fastest growing unstable mode. The λcrit parameter depends on the R/H ratio, where R is the cylinder’s radius and H is the isothermal scale height. For an incompressible fluid, where R << H, the critical wavelength is λcrit = 11R (Nagasawa 1987; Jackson et al. 2010). In contrast, for an infinite isothermal gas cylinder, where R >> H, the critical wavelength becomes λcrit = 22H, with H being defined as
 (10)
(10)
where ceff is the effective sound speed and ρc is the central gas density of a filament (Nagasawa 1987; Inutsuka & Miyama 1992).
Assuming a cylindrical morphology for F1 and F2, we estimated their radii to beR1 - O.O4 pc and R2 - 0.02 pc, respectively, based on their area (A) and length (LF) (Table 1). We estimated the central gas density of F1 and F2 by taking the average of the core densities to represent, as a first order of approximation, the initial filament density. This yields pc1 -1.9 × 10⁻¹⁶ g cm-3 (nc1 - 4.0 × 107 cm-3) for F1 and ρc2 -1.1 × 1O-16 g cm-3 (nc2 - 2.4 × 1O7 cm-3) for F2.
Considering the potential influence of turbulent motions in the entire I18308 cloud (Sect. 3.3.1), we replaced  in Eq. (10) with
  , accounting for both thermal and turbulent contributions. Adopting σtot1 = 0.38 km s-1 for F1 and σtot2 = 0.50 km s-1 for F2 (Table 3), we calculated characteristic isothermal scale heights of H1 - 1.0 × 10⁻³ pc for F1 and H2 - 1.7 × 10⁻³ pc for F2. Consequently, the critical fragmentation scale is λcrit1 ~ 0.02 pc for F1 and λcrit2 ~ 0.04 pc for F2. These λcrit values are three-to-five times lower than the observed deprojected core separations for F1 and F2 (Sect. 3.4.1), suggesting that additional physical factors may be necessary to explain the observed filament fragmentation.
Magnetic fields may significantly influence fragmentation within filaments, potentially suppressing it (e.g., Nakamura et al. 1993; Zhang et al. 2009). Furthermore, the presence of a central massive hub may modify the fragmentation process through its tidal forces. Li (2024) predicted that these tidal forces can increase core spacing within filaments. This may explain the observed trend where core separations generally exceed the critical values expected considering turbulence alone. Of particular interest is that core separations in both F1 and F2 exhibit a gradual decrease toward the central hub. If tidal forces exerted by the gravity of the central massive hub are indeed at work, this suggests that cores formed after filament fragmentation could have been drawn closer to the hub due to these tidal effects. Consequently, we can observe a decreasing core spacing on the approach to the hub and an increasing spacing further away from it. To further elucidate the role of tidal forces in HFSs, additional observational and numerical simulation studies are necessary.
It is worth noting that the estimated central gas density (ρc) of both F1 and F2 could be uncertain. For instance, being ten times lower in ρc, while keeping other parameters fixed, would result in an estimated critical wavelength that is three times higher. This still suggests that filament fragmentation in both F1 and F2 could be at least turbulence-driven.
3.4.3 Hub fragmentation
We analyzed the fragmentation of the central hub clump in I18308 using the spherical Jeans fragmentation framework by comparing the observed core separation and mass with the theoretical Jeans length (LJ) and mass (MJ). The LJ and MJ parameters can be calculated as follows (e.g., Palau et al. 2014; Wang et al. 2014):
 (11)
(11)
where ceff and ρeff are the effective sound speed and the gas density, respectively. Considering the thermal support alone, ceff becomes the thermal sound speed (cth), yielding the thermal Jeans parameters  and
and  . Including both thermal and nonthermal support, ceff corresponds to the total velocity dispersion, σtot, resulting in the turbulent Jeans parameters,
  and
and  .
.
We used the single-dish MAMBO 1.2 mm continuum data to trace the effective initial density on the verge of the hub fragmentation. Specifically, we selected a ~0.15 pc2 area enclosed by the 25σ1.2 mm intensity level (i.e., 275 mJy beam-1) to encompass the central clumpy hub. The average density derived from this area was assumed to represent the initial density of the clumpy hub environment. Given the 17.5 K gas temperature derived from prestellar cores in the hub (presumably representing the initial temperature before fragmentation), a total 1.2 mm flux of 1.1 Jy within the selected 1.2 mm emission area leads to peff,H = 6.6 × 10⁻¹⁹ g cm-3 (neff,H ~ 1.4 × 105 cm-3). Atthis given temperature, the thermal sound speed is cs = 0.25 km s-1. Additionally, we estimated the initial total velocity dispersion of the hub, including both thermal and turbulent motions, to be σtot = 0.60 km s-1, inferred from prestellar cores to approximately reflect the initial condition probably without strong influence from active star formation.
Using cs, σtot, and ρeff,H, derived earlier, we calculated the Jeans parameters:  and
and  for thermal support and 0.16 pc and 22.7 M⊙ for turbulent support. The observed typical core separation of ~0.06 pc and core mass of ~2.7 M⊙ in the hub agrees well with the predicted Jeans scale and mass for pure thermal Jeans fragmentation (Table 4). Accordingly, the turbulent Jeans fragmentation cannot explain the observed parameters of both core separation and mass.
Derived Jeans parameters for the central hub clump.
4 Discussion
4.1 Scale-dependent fragmentation in the HFS I18308
The I18308 cloud exhibits an HFS structure with two hubcomposing filaments converging toward the central hub. Detailed analysis in Sect. 3.4.2 reveals evidence of two distinct fragmentation modes: a cylindrical mode for filaments (both F1 and F2) and a nearly spherical Jeans-like mode for the central clumpy hub. These two modes have also been observed in other filamentary clouds, such as IRDC G11.11 and the Orion integral shape filament (Kainulainen et al. 2013, 2017). These observations suggest that the fragmentation properties of a cloud can vary with spatial scale, potentially due to the (an)isotropic evolution of different density structures into smaller scale substructures. Filaments, directed longitudinally and being more anisotropic, could evolve differently from smaller scale clumps, which tend to evolve radially in a more isotropical manner.
In addition to different geometrical modes of fragmentation, I18308 presents different driving mechanisms for fragmentation at different spatial scales. Along both F1 and F2 filaments, quasi-periodic cores are observed with a typical spacing of 0.11 pc and 0.14 pc, respectively, accounting for projection effects. This quasi-periodic pattern align with the prediction from the classical “sausage” cylindrical fragmentation model, considering turbulence and possibly the tidal effects of the hub. (Sect. 3.4.2). This suggests that the fragmentation of F1 and F2 is at least a turbulence-driven process. It is worth noting that the quasi-periodic spacing shows slight variations (Fig. 4). This could arise from the fact that real molecular clouds are not isolated in perfect hydrostatic equilibrium (Pineda et al. 2023). Dynamical models incorporating gas accretion, turbulence, and other factors could therefore better explain these core-spacing variations in actual filament fragmentation (Clarke et al. 2017, 2020). For example, Clarke et al. (2017) showed that simulations of filaments with ongoing gas accretion from a turbulent medium exhibit two fragmentation modes: initial filamentary fragmentation followed by clumpy fragmentation at the effective Jeans length, which is consistent with observations in I18308.
As analyzed in Sect. 3.4.3, the fragmentation of the central hub clump shows a typical core separation of 0.06 pc, consistent with the thermal Jeans fragmentation model. This indicates a gravity-dominated driving mechanism for hub fragmentation, in contrast to the turbulence-driven mechanism in the hubcomposing filaments. This result agrees with inferences from recent interferometric observations of high-mass star-forming clumps (e.g., Palau et al. 2013; Beuther et al. 2018; Sanhueza et al. 2019; Liu et al. 2019a; Morii et al. 2024; Ishihara et al. 2024).
To further illustrate the fragmentation mechanism, Wang et al. (2014) analyzed the core mass distribution with core separation. This approach has also been used by Xu et al. (2023), Morii et al. (2024), and Das et al. (2024). In this work, we followed the same methodology to compare the thermal and turbulent Jeans fragmentation mechanism. Figure 5 shows the distribution of observed core separations and masses compared to theoretical predictions. The shaded regions represent the Jeans mass and length for a range of physical properties. For thermal Jeans fragmentation (shaded red), the core mass and separation are determined by the temperature and density within the ranges T = [10, 30] K and n = [102, 108] cm-3. For turbulent Jeans fragmentation (shaded green), the temperature (corresponding to the thermal sound speed) is replaced by the total velocity dispersion range of σtot = [0.50,1.10] km s-1 (Table 2). The representative lines within the red and green shaded bands correspond to an average temperature of 17.5 K (Sect. 3.4.3) and an average total velocity dispersion of 0.78 kms-1, respectively. The vertical dashed blue, red, and yellow lines indicate the observed median core separation and those predicted by the thermal and turbulent Jeans fragmentation models.
Figure 5 shows a good agreement between the observed median core separation and the prediction from the thermal Jeans fragmentation mechanism. Additionally, six of nine cores are distributed within the mass-separation band predicted by the thermal Jeans fragmentation model for a range of physical conditions. These results support the dominant role of gravity in driving fragmentation of the central hub. However, three massive cores (c1, c3, and c5) stand out from the major distribution, especially in mass. The two most massive cores (c1 and c3) are located at or near the hub center (Fig. 2). Considering the strong star-forming activity characterized by the (UC) H II region in the hub center, we assume that turbulence in the hub could be locally enhanced. We therefore suggest that these two massive stars formed with an additional support from locally enhanced turbulence. In this context, we conjecture that thermal (gravity-dominated) and turbulent motions may play distinct roles in the fragmentation of the central hub clump. Thermal Jeans fragmentation tends to produce the majority of low-mass cores, while turbulent Jeans fragmentation contributes to the formation of the most massive cores. We anticipate further statistical studies to validate this conjecture.
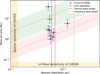 |
Fig. 5 Mass of cores versus their separation in I18308. Blue filled circles represent observed cores. The dotted and solid black lines and the shaded regions are plotted following the outlines described in Wang et al. (2014) and Xu et al. (2023). The dotted black line corresponds to thermal Jeans fragmentation at T = 17.5 K and n = [102, 108] cm-3. The red shaded region was made with the same density range, but for T = [10, 30] K. The solid black line corresponds to turbulent Jeans fragmentation at σtot = 0.78 km s-1 and n = [102,108] cm-3. The green shaded region was made with the same density, but at σtot = [0.50,1.10] km s-1. Vertical blue dashed lines indicate a typical observed core separation of 0.06 pc. Red and orange vertical dashed lines shows the predicted separation for thermal and turbulent Jeans fragmentation models, respectively. Mass sensitivity and spatial sensitivity of ALMA 1.3 mm observations are shown as the orange shaded bands. |
4.2 Dynamic scenario of high-mass star formation in an HFS
As mentioned in Sect. 4.1, the presence of quasi-periodic (not exactly periodic) cores along the hub-composing filaments implies a dynamical fragmentation scenario in HFS I18308. This could accordingly lead to a dynamical scenario of high-mass star formation in I18308.
Theoretically, major models of high-mass star formation can be broadly categorized into two types: turbulent core-accretiontype models (McKee & Tan 2003) and competitive-accretiontype models (Bonnell et al. 2001, 2004). The former posits that high-mass prestellar cores are supported against collapse and fragmentation by strong turbulence and/or magnetic fields. The latter proposes that high-mass stars originate from initial Jeans fragments within a massive clump and subsequently grow in mass through gas accretion while competing with other fragments under gravitational tidal fields (Contreras et al. 2018; Morii et al. 2025). The presence of high-mass prestellar cores is a key discriminator between these two types of models. In I18308, the median mass of prestellar cores is 2.7 M⊙ with a range of [2.1, 5.9] M⊙. We therefore do not identify any candidate high-mass prestellar cores in I18308 (greater than 30 M⊙, corresponding to a 10 M⊙ massive star at a 30% star formation efficiency level) in favor of turbulent core-accretion-type models, which is consistent with the finding from a large sample of investigations, for example in the ASHES survey (Sanhueza et al. 2019).
Complementary to the competitive-accretion-type models are multi-scale dynamical models/hypotheses of high-mass star formation, such as GHC and I2 models, and the filament-to-cluster (F2C) paradigm. These multi-scale models extend dynamical processes to larger scales beyond clumps or cores that traditional models considered. For instance, the global hierarchical collapse model suggests that the Bondi-Hoyle accretion still operates on core scales, as predicted by the competitive-accretion model. In these multi-scale dynamical models, filamentary structures are predicted to undergo self-growth through radial accretion from their surroundings and supply formed clumps or cores through longitudinal accretion. HFSs are often reproduced as common signatures probably due to collisions among filaments in these models as preferential systems for cluster and high-mass star formation. Observationally, longitudinal gas flows along hub-composing filaments-detected in several HFSs to converge toward the hub at typical rates of ~10-4-10-3 M⊙ yr-1-have been shown to account for the required mass accretion (e.g., Yuan et al. 2018; Chen et al. 2019; Trevino-Morales et al. 2019; Sanhueza et al. 2021; Liu et al. 2022; Yang et al. 2023; Sanhueza et al. 2025; Sandoval-Garrido et al. 2025; Álvarez-Gutiérrez et al. 2024; Morii et al. 2025). The multi-scale dynamical gas accumulation/accretion scenario has also been observed down to protostar scales, as evidenced by gas infall signatures on both clump and core scales (e.g., Yang et al. 2023; Pan et al. 2024).
A dynamical scenario of high-mass star formation in HFSs can be scrutinized through multi-scale kinematic observations, which is beyond the scope of this work. Here, we explored a dynamical scenario based on the evolution of several core physical properties over time in the central hub of I18308. Table 5 shows that for the hub region the mean mass and surface density of protostellar cores (8.9 M⊙, 11.9 g cm-2) exceed those of prestellar cores (3.5 M⊙, 1.7 g cm-2), respectively. Additionally, the mean temperature of protostellar cores (20.8 K) is on average higher than that of prestellar cores (17.5 K), while the radius of protostellar cores (1.9 × 10³ AU) is smaller on average. These comparisons suggest continuous mass accumulation during the evolution from prestellar to protostellar stages, resulting in an increased mass, increased density, reduced radius, and elevated temperature within the cores, which is well in agreement with results of previous studies (e.g., Morii et al. 2024; Xu et al. 2024). Such growth in both mass and density align with predictions from multi-scale dynamical gas-accretion models of high-mass star formation, providing a viable pathway for forming massive stars without requiring preexisting massive prestellar cores. For example, both GHC and I2 models favor core collapse into a low-to-intermediate-mass protostar, followed by accretion of remaining mass via a circumstellar disk from its natal surroundings up to the filament scale. In this context, the well-defined HFS morphology in I18308 suggests the multiscale dynamical scenario discussed above could be responsible for the highest core masses in the hub center, associated with a UC H II region potentially fed by large-scale hub-composing filaments. This dynamical scenario warrants further confirmation with future high-angular and spectral-resolution kinematic observations.
It is worth noting that while the latest high-mass star formation models (e.g., GHC and I2) agree on multi-scale dynamics and gravity-driven small-scale (e.g., core) mass accretion, they predict distinct large-scale drivers for multi-scale mass accretion: GHC supports gravity-driven hierarchical mass accretion, while I2 advocates for turbulence-driven mass inflow/accretion. As discussed earlier, filament-scale fragmentation in F1 and F2 is at least turbulence-driven, possibly with an additional magnetic support, while clumpy hub fragmentation is mostly gravity-driven. These results suggest that in I18308, turbulence drives large-scale filament dynamics, and gravity takes over on the smaller scale hub. Nevertheless, to ultimately address the model discrepancies on driving mechanisms for the multi-scale dynamical scenario, future detailed multi-scale kinematic and dynamical studies are needed.
The average parameters of protostellar and prestellar cores within the hub.
5 Conclusion
We present new ALMA 1.3 mm observations of the HFS cloud I18308 with ongoing high-mass star formation at ~0″.7 angular resolution (~3000 AU). We analyzed filament and hub fragmentation and an associated dynamical scenario of high-mass star formation in I18308. Our major findings are listed below:
The I18308 cloud exhibits a well-defined HFS morphology with two hub-composing filaments (F1 and F2) converging toward the central hub. F1 has a mass of MF = 171 M⊙ and a mass surface density of ΣF(H2) ~ 0.6 g cm-2. F2 has MF = 51 M⊙ and ΣF(H2) ~ 0.4 g cm-2. The hub has MH = 185 M⊙ and ΣH(H2) ~ 0.6 g cm-2. These results suggest a higher likelihood of high-mass star formation in the hub, which agrees with the presence of a UC H II region therein;
Eighteen compact cores are identified: nine in the hub, six in F1, and three in F2. Most cores are gravitationally bound with virial parameters of α < 2 and have mass surface densities of ΣC(H2) > 1 g cm-2. These results provide further evidence of the significant potential for high-mass star formation in the hub;
The I18308 HFS cloud shows scale-dependent fragmentation modes: a cylindrical mode for hub-composing filaments (F1 and F2) and a nearly spherical Jeans-like mode for the central hub clump. This could be attributed to the (an)isotropic evolution of density structures into smaller scale substructures. Filaments, being more anisotropic, may evolve differently from smaller scale clumps, which tend to evolve more isotropically;
I18308 also presents scale-dependent fragmentation mechanisms. In F1 and F2, quasi-periodic cores with a typical deprojected spacing of 0.11 pc and 0.14 pc, respectively, can be explained by turbulence-driven filamentary fragmentation. In the hub, gravity-driven (pure thermal Jeans) fragmentation can lead to a typical observed core spacing of 0.06 pc;
No candidate high-mass prestellar cores (greater than 30 M⊙) are identified across the I18308 cloud. In the hub, protostellar cores a have higher mean mass, surface density, and temperature; and a smaller mean radius than prestellar cores. This suggests continuous mass accumulation during the evolution from prestellar to protostellar stages, leading to increased mass, density, and temperature, and a reduced radius within cores.
From the well-defined HFS morphology in the high-mass starforming I18308 cloud, the absence of high-mass prestellar cores, and the trends of increasing mass and mass surface density of cores from prestellar to protostellar stages, we suggest a multiscale dynamical scenario for high-mass star formation in I18308. This scenario could involve the initial collapse of cores in the central hub into low-to-intermediate-mass protostars, followed by a multi-scale accretion of remaining mass from their natal surroundings up to the filament scale. This dynamical process offers a viable pathway for forming high-mass stars without the premise of preexisting massive prestellar cores, as predicted by recent high-mass star formation models such as GHC and I2.
Acknowledgements
This work is supported by the National Key R&D Program of China (No. 2022YFA1603101) and the National Natural Science Foundation of China (NSFC) through grant Nos. 12273090 and 12322305. H.-L. Liu is supported by Yunnan Fundamental Research Project (grant No. 202301AT070118, 202401AS070121), and by Xingdian Talent Support Plan-Youth Project. X.L is supported by the Strategic Priority Research Program of the Chinese Academy of Sciences (CAS) Grant No. XDB0800300, the Natural Science Foundation of Shanghai (No. 23ZR1482100) and the CAS “Light of West China” Program No. xbzg-zdsys-202212. R.G.M. is support by DGAPA UNAM PAPIIT project IN105225. P.S was partially supported by a Grant-in-Aid for Scientific Research (KAKENHI Number JP22H01271 and JP23H01221) of JSPS.
Appendix A Maps of velocity, rotation temperature and line width of NH3 (1-1)
Figure A shows the mean velocity, the rotation temperature and the line-width maps derived from NH3(1-1) observations by Lu et al. (2014).
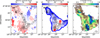 |
Fig. A Panel a: Mean velocity (moment 1) map of NH3(1-1) from the VLA 22GHz observations (Lu et al. 2018) overlaid with contours of ALMA 1.3 mm continuum emission. The F1, F2 and hub regions have roughly coherent velocities. Panel b: Rotation temperature map derived from NH3(1-1) observations by the VLA. Panel c: NH3(1-1) line width map. The black contours are at [2, 5, 10, 20, 40, 80, 160] × σ1.3 mm (σ1.3 mm = 0.1 mJy beam-1) and have been smoothed for better visualization. The synthesized beam of O.71″ × O.59″ and a 0.1 pc scale bar are shown in the lower left and lower right corners, respectively. |
Appendix B Fragments identification
The dendrogram algorithm (Rosolowsky et al. 2008) was adopted to extract extended fragments from the ALMA 1.3 mm continuum map, as opposed to compact cores. The input parameters for dendrogram are: min_value, min_delta, min_npix. We set min_value= 5σ1.3 mm (σ1.3 mm = 0.1 mJy beam-1) to remove unreliable signals. We adopted min_delta= 2σ1.3 mm to distinguish fragments. min_npix is the minimum number of pixels, selected to be the corresponding number of pixels within a structure. The angular resolution (θmaj = 0.71″ and θmin = 0.59″) determines min_npix , where Apix is the pixel area. The algorithm identified three major structures: leafs, branches, and trunks. Small structures, called ‘leaves’, cannot further break up and are defined as fragments investigated here. A total of 16 fragments were obtained. Some fragments correspond to cores extracted by getsf (Cheng et al. (2024), see the left map of Fig. 2). Excluding these, we finally identified 5 new fragments (see Fig. B), which are located in the F1 and F2 filaments. Dendrogram parameters of these new fragments, including the coordinates, radius, and integrated flux at 1.3 mm, are listed in Table B. Several derived parameters, including mass, is also given, following the calculation approach in Sect. 3.2.1.
Parameters of fragments in HFS
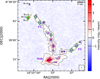 |
Fig. B Results of 15 fragments identification using astrodendro overlaid on the ALMA 1.3 mm continuum image. The F1, F2 filaments, and hub are the same as in Fig. 2. The grey contour outlines fragments identified by astrodendro, and the blue ellipse fits these fragments. Green diamonds indicates five new fragments, complementary to cores identified by Cheng et al. (2024). The four northern region cores marked Nc1-Nc4. Green stars and blue crosses indicate protostellar and prestellar cores (classified by Cheng et al. (2024). The synthesized beam of 0.71″ × 0.59″ and a 0.1 pc scale bar are shown in the lower and top right corners, respectively. |
Appendix C Evolutionary stages of cores
We adopted the evolutionary stages (prestellar or protostellar) as classified in Cheng et al. (2024) for 18 dense cores analyzed in Sect. 3.1.2. This classification was based on the association of each core with molecular outflows and warm gas tracers. Molecular outflows were identified using tracers such as CO 2-1, SiO 5-4, SO, H2CO, and CH3OH lines. Seven cores (7/18) exhibit clear molecular outflows and are thus classified as protostellar (Fig. C1, Fig. C2, and Fig. C3).
To complement the identification of star-forming cores, we searched for associated line emission from “warm core" tracers, including two H2CO warm transitions (32,2 - 22,1) (218.475632 GHz, Eu/k=68.09 K), (32,1 - 22,0) (218.760066 GHz, Eu/k=68.11 K), CH3OH (42,2 - 31,2) (218.440063 GHz, Eu/k=45.56 K), and HC3N 24-23 (218.324723 GHz, Eu/k=130.98 K). These lines with a relatively high upper energy temperature are likely excited by internal heating from star-forming activity and thus serve as indicators of star formation. Integration maps of these lines are shown in Fig. C1, Fig C2 and Fig C3. For each core, we examined both the spectrum and integrated intensity map of line emission across its physical extent. A core was classified as a warm source if an intensity peak exceeding 4 σ was detected in any of the three spectral lines, and the emission exhibited a centrally peaked, compact morphology associated with dense cores. This criterion identified 11 warm cores, 6 of which are also associated with outflows. Cores lacking both molecular outflows and warm core tracers were classified as prestellar candidates.
In summary, among the 18 cores in I18308, 6 are prestellar candidates, and 12 are protostellar (7/12 identified via outflows and 11/12 via warm core tracers).
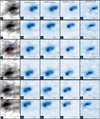 |
Fig. C.1 Classification of core evolutionary stages based on molecular outflow and warm gas tracers for core 1-6. The first column shows the 1.3 mm continuum emission in grey colorscale and black contours, overlaid with the CO 2-1 integration map in blue and red contours. The contour levels for continuum are 1.3×10⁻⁴ Jy beam-1 ×(5, 10, 20, 40, 80, 160). The CO emission is integrated over 5 to 15 km s-1 relative to the systemic velocity for each core for blueshifted and redshifted lobe, respectively, with levels of 0.03 Jy beam-1 km s-1 × (10, 20, 40, 80, 160). The shaded blue and red arrows show the orientation of the identified outflows. The Columns 2-5 show the integration map of different lines over 5 km s-1 interval centered on the systemic velocity, with contour levels σ^×(5, 10, 20, 40, 80). In all panels the core is indicated by one or more ellipse, with green color indicating prestellar, magenta indicating association with molecular outflow, and orange indicating association with “warm core” tracers. |
References
- Álvarez-Gutiérrez, R. H., Stutz, A. M., Sandoval-Garrido, N., et al. 2024, A&A, 689, A74 [NASA ADS] [CrossRef] [EDP Sciences] [Google Scholar]
- André, P., Men’shchikov, A., Bontemps, S., et al. 2010, A&A, 518, L102 [NASA ADS] [CrossRef] [EDP Sciences] [Google Scholar]
- André, P., Di Francesco, J., Ward-Thompson, D., et al. 2014, in Protostars and Planets VI, eds. H. Beuther, R. S. Klessen, C. P. Dullemond, & T. Henning, 27 [Google Scholar]
- André, P., Arzoumanian, D., Könyves, V., Shimajiri, Y., & Palmeirim, P. 2019, A&A, 629, L4 [Google Scholar]
- Barnes, A. T., Longmore, S. N., Avison, A., et al. 2019, MNRAS, 486, 283 [NASA ADS] [CrossRef] [Google Scholar]
- Benjamin, R. A., Churchwell, E., Babler, B. L., et al. 2003, PASP, 115, 953 [Google Scholar]
- Bertoldi, F., & McKee, C. F. 1992, ApJ, 395, 140 [NASA ADS] [CrossRef] [Google Scholar]
- Beuther, H., Schilke, P., Menten, K. M., et al. 2002, ApJ, 566, 945 [Google Scholar]
- Beuther, H., Mottram, J. C., Ahmadi, A., et al. 2018, A&A, 617, A100 [NASA ADS] [CrossRef] [EDP Sciences] [Google Scholar]
- Bohlin, R. C., Savage, B. D., & Drake, J. F. 1978, ApJ, 224, 132 [Google Scholar]
- Bonnell, I. A., Bate, M. R., Clarke, C. J., & Pringle, J. E. 2001, MNRAS, 323, 785 [Google Scholar]
- Bonnell, I. A., Vine, S. G., & Bate, M. R. 2004, MNRAS, 349, 735 [Google Scholar]
- Chandrasekhar, S., & Fermi, E. 1953, ApJ, 118, 116 [Google Scholar]
- Chen, H.-R. V., Zhang, Q., Wright, M. C. H., et al. 2019, ApJ, 875, 24 [Google Scholar]
- Cheng, Y., Lu, X., Sanhueza, P., et al. 2024, ApJ, 967, 56 [Google Scholar]
- Clarke, S. D., Whitworth, A. P., Duarte-Cabral, A., & Hubber, D. A. 2017, MNRAS, 468, 2489 [Google Scholar]
- Clarke, S. D., Williams, G. M., & Walch, S. 2020, MNRAS, 497, 4390 [NASA ADS] [CrossRef] [Google Scholar]
- Contreras, Y., Sanhueza, P., Jackson, J. M., et al. 2018, ApJ, 861, 14 [Google Scholar]
- Das, S. R., Merello, M., Bronfman, L., et al. 2024, MNRAS, 534, 3832 [Google Scholar]
- Dewangan, L. K., Bhadari, N. K., Maity, A. K., et al. 2025, AJ, 169, 80 [NASA ADS] [CrossRef] [Google Scholar]
- Galván-Madrid, R., Liu, H. B., Zhang, Z. Y., et al. 2013, ApJ, 779, 121 [CrossRef] [Google Scholar]
- Ginsburg, A., Henkel, C., Ao, Y., et al. 2016, A&A, 586, A50 [NASA ADS] [CrossRef] [EDP Sciences] [Google Scholar]
- Gower, J. C., & Ross, G. J. S. 1969, J. Roy. Statist. Soc. Ser. C (Appl. Statist.), 18, 54 [Google Scholar]
- Hacar, A., Clark, S. E., Heitsch, F., et al. 2023, in Astronomical Society of the Pacific Conference Series, 534, Protostars and Planets VII, eds. S. Inutsuka, Y. Aikawa, T. Muto, K. Tomida, & M. Tamura, 153 [Google Scholar]
- Hacar, A., Konietzka, R., Seifried, D., et al. 2025, A&A, 694, A69 [NASA ADS] [CrossRef] [EDP Sciences] [Google Scholar]
- He, Y.-X., Liu, H.-L., Tang, X.-D., et al. 2023, ApJ, 957, 61 [NASA ADS] [CrossRef] [Google Scholar]
- Hildebrand, R. H. 1983, QJRAS, 24, 267 [NASA ADS] [Google Scholar]
- Inutsuka, S.-I., & Miyama, S. M. 1992, ApJ, 388, 392 [CrossRef] [Google Scholar]
- Inutsuka, S.-i., & Miyama, S. M. 1997, ApJ, 480, 681 [NASA ADS] [CrossRef] [Google Scholar]
- Ishihara, K., Sanhueza, P., Nakamura, F., et al. 2024, ApJ, 974, 95 [NASA ADS] [CrossRef] [Google Scholar]
- Jackson, J. M., Finn, S. C., Chambers, E. T., Rathborne, J. M., & Simon, R. 2010, ApJ, 719, L185 [Google Scholar]
- Kainulainen, J., Ragan, S. E., Henning, T., & Stutz, A. 2013, A&A, 557, A120 [NASA ADS] [CrossRef] [EDP Sciences] [Google Scholar]
- Kainulainen, J., Stutz, A. M., Stanke, T., et al. 2017, A&A, 600, A141 [NASA ADS] [CrossRef] [EDP Sciences] [Google Scholar]
- Kauffmann, J., Bertoldi, F., Bourke, T. L., Evans, N. J. I., & Lee, C. W. 2008, A&A, 487, 993 [NASA ADS] [CrossRef] [EDP Sciences] [Google Scholar]
- Kauffmann, J., Pillai, T., & Goldsmith, P. F. 2013, ApJ, 779, 185 [NASA ADS] [CrossRef] [Google Scholar]
- Könyves, V., André, P., Arzoumanian, D., et al. 2020, A&A, 635, A34 [Google Scholar]
- Krumholz, M. R., & McKee, C. F. 2008, Nature, 451, 1082 [Google Scholar]
- Kumar, M. S. N., Palmeirim, P., Arzoumanian, D., & Inutsuka, S. I. 2020, A&A, 642, A87 [EDP Sciences] [Google Scholar]
- Li, G.-X. 2024, MNRAS, 532, 1126 [NASA ADS] [CrossRef] [Google Scholar]
- Li, S., Sanhueza, P., Lu, X., et al. 2022, ApJ, 939, 102 [CrossRef] [Google Scholar]
- Liu, H. B., Quintana-Lacaci, G., Wang, K., et al. 2012, ApJ, 745, 61 [NASA ADS] [CrossRef] [Google Scholar]
- Liu, H. B., Chen, H.-R. V., Román-Zúñiga, C. G., et al. 2019a, ApJ, 871, 185 [Google Scholar]
- Liu, H.-L., Stutz, A., & Yuan, J.-H. 2019b, MNRAS, 487, 1259 [Google Scholar]
- Liu, H.-L., Tej, A., Liu, T., et al. 2022, MNRAS, 510, 5009 [NASA ADS] [CrossRef] [Google Scholar]
- Liu, H.-L., Tej, A., Liu, T., et al. 2023, MNRAS, 522, 3719 [NASA ADS] [CrossRef] [Google Scholar]
- Lu, X., Zhang, Q., Liu, H. B., Wang, J., & Gu, Q. 2014, ApJ, 790, 84 [NASA ADS] [CrossRef] [Google Scholar]
- Lu, X., Zhang, Q., Liu, H. B., et al. 2018, ApJ, 855, 9 [Google Scholar]
- Lu, X., Cheng, Y., Ginsburg, A., et al. 2020, ApJ, 894, L14 [NASA ADS] [CrossRef] [Google Scholar]
- Luo, A.-X., Liu, H.-L., Li, G.-X., Pan, S., & Yang, D.-T. 2024a, Res. Astron. Astrophys., 24, 065003 [Google Scholar]
- Luo, A.-X., Liu, H.-L., Qin, S.-L., Yang, D.-t., & Pan, S. 2024b, AJ, 167, 228 [Google Scholar]
- Luo, A.-X., Liu, H.-L., & Li, J.-Z. 2025, ApJ, 981, 147 [Google Scholar]
- Martin, P. G., Roy, A., Bontemps, S., et al. 2012, ApJ, 751, 28 [NASA ADS] [CrossRef] [Google Scholar]
- McKee, C. F., & Tan, J. C. 2003, ApJ, 585, 850 [Google Scholar]
- Men’shchikov, A. 2021, A&A, 649, A89 [EDP Sciences] [Google Scholar]
- Molinari, S., Swinyard, B., Bally, J., et al. 2010, A&A, 518, L100 [NASA ADS] [CrossRef] [EDP Sciences] [Google Scholar]
- Morii, K., Sanhueza, P., Nakamura, F., et al. 2023, ApJ, 950, 148 [NASA ADS] [CrossRef] [Google Scholar]
- Morii, K., Sanhueza, P., Zhang, Q., et al. 2024, ApJ, 966, 171 [Google Scholar]
- Morii, K., Sanhueza, P., Csengeri, T., et al. 2025, ApJ, 979, 233 [Google Scholar]
- Myers, P. C. 2009, ApJ, 700, 1609 [Google Scholar]
- Nagasawa, M. 1987, Progr. Theor. Phys., 77, 635 [NASA ADS] [CrossRef] [Google Scholar]
- Nakamura, F., Hanawa, T., & Nakano, T. 1993, PASJ, 45, 551 [NASA ADS] [Google Scholar]
- Ossenkopf, V., & Henning, T. 1994, A&A, 291, 943 [NASA ADS] [Google Scholar]
- Padoan, P., Pan, L., Juvela, M., Haugbølle, T., & Nordlund, A. 2020, ApJ, 900, 82 [Google Scholar]
- Palau, A., Fuente, A., Girart, J. M., et al. 2013, ApJ, 762, 120 [NASA ADS] [CrossRef] [Google Scholar]
- Palau, A., Estalella, R., Girart, J. M., et al. 2014, ApJ, 785, 42 [Google Scholar]
- Pan, S., Liu, H.-L., & Qin, S.-L. 2024, ApJ, 960, 76 [NASA ADS] [CrossRef] [Google Scholar]
- Pineda, J. E., Arzoumanian, D., Andre, P., et al. 2023, in Astronomical Society of the Pacific Conference Series, 534, Protostars and Planets VII, eds. S. Inutsuka, Y. Aikawa, T. Muto, K. Tomida, & M. Tamura, 233 [Google Scholar]
- Reid, M. J., Menten, K. M., Brunthaler, A., et al. 2019, ApJ, 885, 131 [Google Scholar]
- Rosolowsky, E. W., Pineda, J. E., Kauffmann, J., & Goodman, A. A. 2008, ApJ, 679, 1338 [Google Scholar]
- Roy, A., Martin, P. G., Polychroni, D., et al. 2013, ApJ, 763, 55 [Google Scholar]
- Saha, A., Tej, A., Liu, H.-L., et al. 2022, MNRAS, 516, 1983 [NASA ADS] [CrossRef] [Google Scholar]
- Sandoval-Garrido, N. A., Stutz, A. M., Álvarez-Gutiérrez, R. H., et al. 2025, A&A, 696, A202 [NASA ADS] [CrossRef] [EDP Sciences] [Google Scholar]
- Sanhueza, P., Jackson, J. M., Zhang, Q., et al. 2017, ApJ, 841, 97 [Google Scholar]
- Sanhueza, P., Contreras, Y., Wu, B., et al. 2019, ApJ, 886, 102 [Google Scholar]
- Sanhueza, P., Girart, J. M., Padovani, M., et al. 2021, ApJ, 915, L10 [NASA ADS] [CrossRef] [Google Scholar]
- Sanhueza, P., Liu, J., Morii, K., et al. 2025, ApJ, 980, 87 [Google Scholar]
- Shen, X., Liu, H.-L., Ren, Z., et al. 2024, ApJ, 974, 239 [Google Scholar]
- Shen, X. J., Hou, L. G., Liu, H. L., & Gao, X. Y. 2025, A&A, 696, A67 [NASA ADS] [CrossRef] [EDP Sciences] [Google Scholar]
- Tafalla, M., & Hacar, A. 2015, A&A, 574, A104 [NASA ADS] [CrossRef] [EDP Sciences] [Google Scholar]
- Trevino-Morales, S. P., Fuente, A., Sánchez-Monge, A., et al. 2019, A&A, 629, A81 [NASA ADS] [CrossRef] [EDP Sciences] [Google Scholar]
- Urquhart, J. S., Moore, T. J. T., Csengeri, T., et al. 2014, MNRAS, 443, 1555 [Google Scholar]
- Vázquez-Semadeni, E., Palau, A., Ballesteros-Paredes, J., Gômez, G. C., & Zamora-Avilés, M. 2019, MNRAS, 490, 3061 [CrossRef] [Google Scholar]
- Wang, K., Zhang, Q., Testi, L., et al. 2014, MNRAS, 439, 3275 [Google Scholar]
- Webb, K. A., Di Francesco, J., Sadavoy, S., et al. 2017, ApJ, 849, 13 [Google Scholar]
- Xu, F.-W., Wang, K., Liu, T., et al. 2023, MNRAS, 520, 3259 [NASA ADS] [CrossRef] [Google Scholar]
- Xu, F., Wang, K., Liu, T., et al. 2024, ApJS, 270, 9 [NASA ADS] [CrossRef] [Google Scholar]
- Yang, D., Liu, H.-L., Tej, A., et al. 2023, ApJ, 953, 40 [NASA ADS] [CrossRef] [Google Scholar]
- Yuan, J., Li, J.-Z., Wu, Y., et al. 2018, ApJ, 852, 12 [Google Scholar]
- Yuan, L., Yang, J., Du, F., et al. 2021, ApJS, 257, 51 [NASA ADS] [CrossRef] [Google Scholar]
- Zhang, Q., Wang, Y., Pillai, T., & Rathborne, J. 2009, ApJ, 696, 268 [Google Scholar]
- Zhang, G.-Y., André, P., Men’shchikov, A., & Wang, K. 2020, A&A, 642, A76 [NASA ADS] [CrossRef] [EDP Sciences] [Google Scholar]
The typical 10% uncertainty for the kinematic distance estimate approach was adopted (e.g., Reid et al. 2019; Shen et al. 2025).
All Tables
All Figures
|
Fig. 1 Presentation of I18308 cloud with three-color composite image, combining Spitzer 3.6 μm (blue), 4.5 μm (green), and 8.0 μm (red) emission. The dashed cyan loop outlines the ALMA mosaic field at 1.3 mm toward I18308. White contours depict 1.3 mm dust-emission intensities at [3, 9, 15, 27, 81, 243] × σ1.3 mm, where σ1.3 mm = 0.1 mJy beam-1. Gray contours show cold dust emission from the single-dish MAMBO survey at 1.2 mm, starting from 5σMAMBO in steps of 5σMAMBO, with 1σMAMBO ~ 11 mJy beam-1 (Beuther et al. 2002). The blue contour corresponds to a level of 25σMAMBO, encompassing the hub region. The blue and green crosses pinpoint the primary and secondary peaks of 1.3 cm free-free emission, respectively, typical of the (UC) H II regions (Lu et al. 2018). The synthesized beam sizes are 11″ × 11″ for the MAMBO observations and 0.71″ × 0.59″ for the ALMA ones, indicated in the lower left and right corners, respectively. A scale bar of 0.5 pc is shown in the top right corner. |
| In the text | |
|
Fig. 2 Left: combined (feathered) ALMA 1.3 mm continuum map of I18308. Eighteen cores c1-c18 are marked with their FWHM ellipses. Five extended fragments (f1-f5) are marked with the green diamonds. The dashed gray contour outlines the 2σ1.3 mm boundary of three hierarchical regions: F1, F2, and the hub. The blue and green crosses mark the locations of the compact peak (Peak 1) and secondary peak (Peak 2) in the (UC) H II region detected by the VLA 1.3 cm (Lu et al. 2018). Right: ALMA 1.3 mm continuum map of I18308. The black contours are at [5, 10, 20, 40, 80, 160] × σ1.3 mm (σ1.3 mm = 0.1 mJy beam-1). The dashed black contour outlines the 2σ1.3 mm boundary of three hierarchical regions: F1, F2, and the hub. Green stars and blue crosses indicate protostellar and prestellar cores, respectively. Green diamonds indicate additional extended fragments. The synthesized beam and a 0.1 pc scale bar are shown in the lower left and lower right corners, respectively. |
| In the text | |
|
Fig. 3 Surface density versus core masses. Stars and crosses indicate protostellar and prestellar cores, respectively. Squares denote the F1 and F2 filaments and the hub. Orange represents F2, green represents F1, blue represents the hub clump. Green and red vertical lines indicate surface density thresholds of 0.05 g cm-2 (Urquhart et al. 2014) and 1 g cm-2 (Krumholz & McKee 2008), respectively, while the horizontal line denotes a core mass of 8 M⊙. |
| In the text | |
|
Fig. 4 Spatial distribution of core spacing in I18308. The background shows the ALMA 1.3 mm continuum image. The boundary of the F1, F2, and hub regions is the same as in Fig. 2. Blue dots mark core locations, while green diamonds represent fragments. The solid yellow line denotes the minimum path connecting these elements, given by the MST algorithm (see Sect. 3.4.1). The synthesized beam of 0.71″ × 0.59″ and a 0.1 pc scale bar are shown in the lower left and lower right corners, respectively. |
| In the text | |
|
Fig. 5 Mass of cores versus their separation in I18308. Blue filled circles represent observed cores. The dotted and solid black lines and the shaded regions are plotted following the outlines described in Wang et al. (2014) and Xu et al. (2023). The dotted black line corresponds to thermal Jeans fragmentation at T = 17.5 K and n = [102, 108] cm-3. The red shaded region was made with the same density range, but for T = [10, 30] K. The solid black line corresponds to turbulent Jeans fragmentation at σtot = 0.78 km s-1 and n = [102,108] cm-3. The green shaded region was made with the same density, but at σtot = [0.50,1.10] km s-1. Vertical blue dashed lines indicate a typical observed core separation of 0.06 pc. Red and orange vertical dashed lines shows the predicted separation for thermal and turbulent Jeans fragmentation models, respectively. Mass sensitivity and spatial sensitivity of ALMA 1.3 mm observations are shown as the orange shaded bands. |
| In the text | |
|
Fig. A Panel a: Mean velocity (moment 1) map of NH3(1-1) from the VLA 22GHz observations (Lu et al. 2018) overlaid with contours of ALMA 1.3 mm continuum emission. The F1, F2 and hub regions have roughly coherent velocities. Panel b: Rotation temperature map derived from NH3(1-1) observations by the VLA. Panel c: NH3(1-1) line width map. The black contours are at [2, 5, 10, 20, 40, 80, 160] × σ1.3 mm (σ1.3 mm = 0.1 mJy beam-1) and have been smoothed for better visualization. The synthesized beam of O.71″ × O.59″ and a 0.1 pc scale bar are shown in the lower left and lower right corners, respectively. |
| In the text | |
|
Fig. B Results of 15 fragments identification using astrodendro overlaid on the ALMA 1.3 mm continuum image. The F1, F2 filaments, and hub are the same as in Fig. 2. The grey contour outlines fragments identified by astrodendro, and the blue ellipse fits these fragments. Green diamonds indicates five new fragments, complementary to cores identified by Cheng et al. (2024). The four northern region cores marked Nc1-Nc4. Green stars and blue crosses indicate protostellar and prestellar cores (classified by Cheng et al. (2024). The synthesized beam of 0.71″ × 0.59″ and a 0.1 pc scale bar are shown in the lower and top right corners, respectively. |
| In the text | |
|
Fig. C.1 Classification of core evolutionary stages based on molecular outflow and warm gas tracers for core 1-6. The first column shows the 1.3 mm continuum emission in grey colorscale and black contours, overlaid with the CO 2-1 integration map in blue and red contours. The contour levels for continuum are 1.3×10⁻⁴ Jy beam-1 ×(5, 10, 20, 40, 80, 160). The CO emission is integrated over 5 to 15 km s-1 relative to the systemic velocity for each core for blueshifted and redshifted lobe, respectively, with levels of 0.03 Jy beam-1 km s-1 × (10, 20, 40, 80, 160). The shaded blue and red arrows show the orientation of the identified outflows. The Columns 2-5 show the integration map of different lines over 5 km s-1 interval centered on the systemic velocity, with contour levels σ^×(5, 10, 20, 40, 80). In all panels the core is indicated by one or more ellipse, with green color indicating prestellar, magenta indicating association with molecular outflow, and orange indicating association with “warm core” tracers. |
| In the text | |
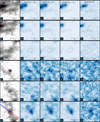 |
Fig. C2 Same as Fig. C1 but for core 7-12. |
| In the text | |
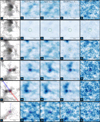 |
Fig. C3 Same as Fig. C1 but for core 13-18. |
| In the text | |
Current usage metrics show cumulative count of Article Views (full-text article views including HTML views, PDF and ePub downloads, according to the available data) and Abstracts Views on Vision4Press platform.
Data correspond to usage on the plateform after 2015. The current usage metrics is available 48-96 hours after online publication and is updated daily on week days.
Initial download of the metrics may take a while.