Fig. 2
Download original image
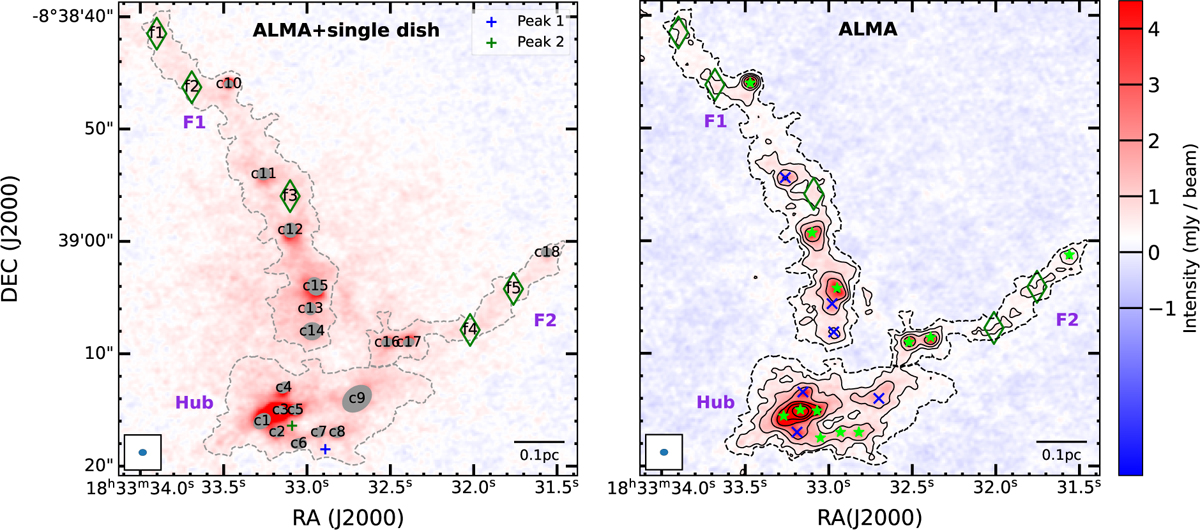
Left: combined (feathered) ALMA 1.3 mm continuum map of I18308. Eighteen cores c1-c18 are marked with their FWHM ellipses. Five extended fragments (f1-f5) are marked with the green diamonds. The dashed gray contour outlines the 2σ1.3 mm boundary of three hierarchical regions: F1, F2, and the hub. The blue and green crosses mark the locations of the compact peak (Peak 1) and secondary peak (Peak 2) in the (UC) H II region detected by the VLA 1.3 cm (Lu et al. 2018). Right: ALMA 1.3 mm continuum map of I18308. The black contours are at [5, 10, 20, 40, 80, 160] × σ1.3 mm (σ1.3 mm = 0.1 mJy beam-1). The dashed black contour outlines the 2σ1.3 mm boundary of three hierarchical regions: F1, F2, and the hub. Green stars and blue crosses indicate protostellar and prestellar cores, respectively. Green diamonds indicate additional extended fragments. The synthesized beam and a 0.1 pc scale bar are shown in the lower left and lower right corners, respectively.
Current usage metrics show cumulative count of Article Views (full-text article views including HTML views, PDF and ePub downloads, according to the available data) and Abstracts Views on Vision4Press platform.
Data correspond to usage on the plateform after 2015. The current usage metrics is available 48-96 hours after online publication and is updated daily on week days.
Initial download of the metrics may take a while.