Fig. 4
Download original image
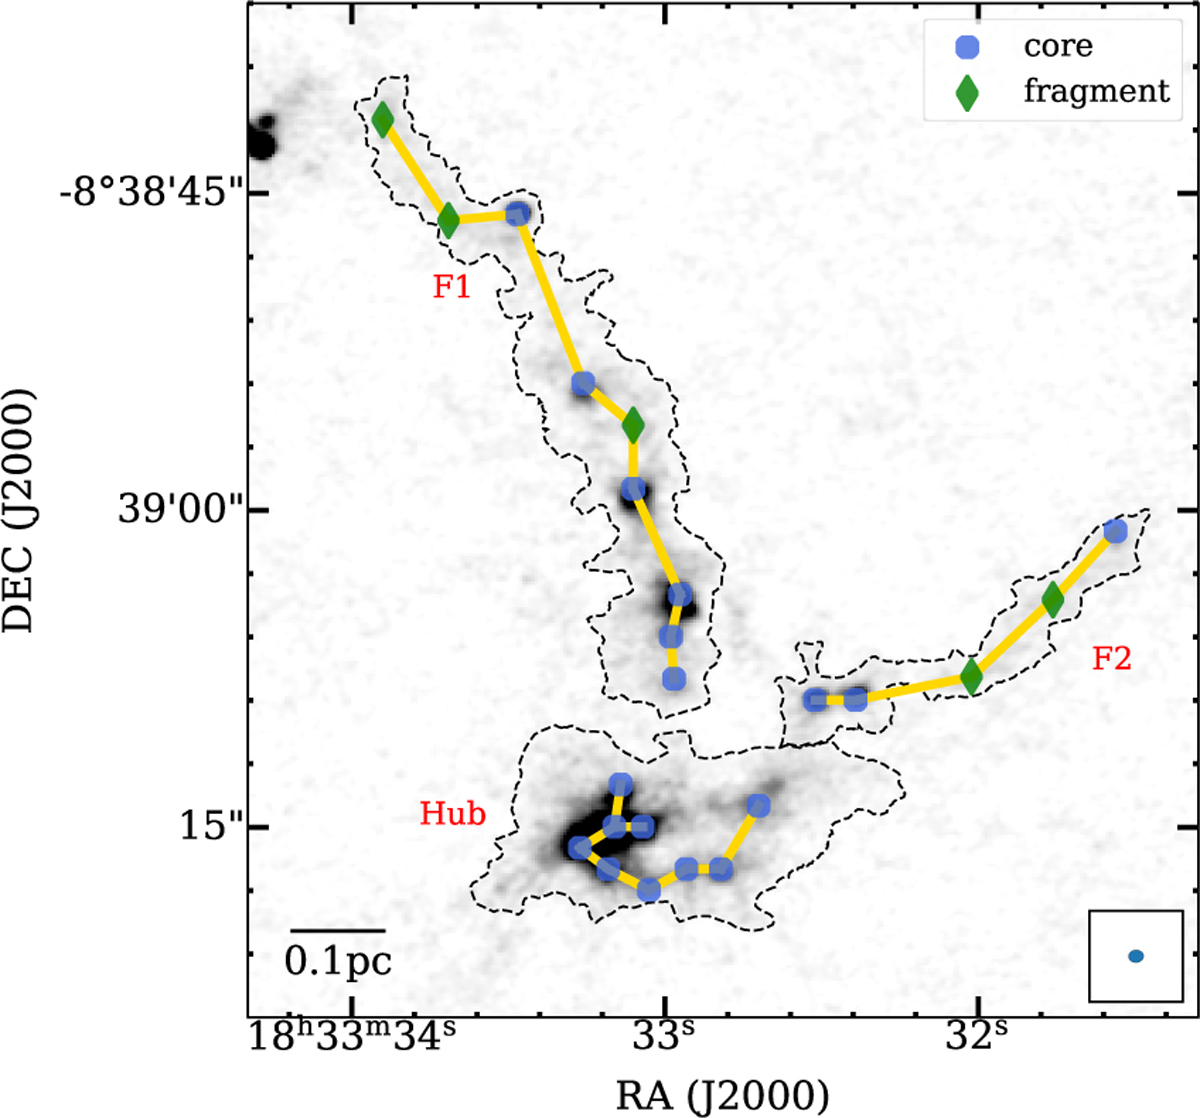
Spatial distribution of core spacing in I18308. The background shows the ALMA 1.3 mm continuum image. The boundary of the F1, F2, and hub regions is the same as in Fig. 2. Blue dots mark core locations, while green diamonds represent fragments. The solid yellow line denotes the minimum path connecting these elements, given by the MST algorithm (see Sect. 3.4.1). The synthesized beam of 0.71″ × 0.59″ and a 0.1 pc scale bar are shown in the lower left and lower right corners, respectively.
Current usage metrics show cumulative count of Article Views (full-text article views including HTML views, PDF and ePub downloads, according to the available data) and Abstracts Views on Vision4Press platform.
Data correspond to usage on the plateform after 2015. The current usage metrics is available 48-96 hours after online publication and is updated daily on week days.
Initial download of the metrics may take a while.