Fig. 5
Download original image
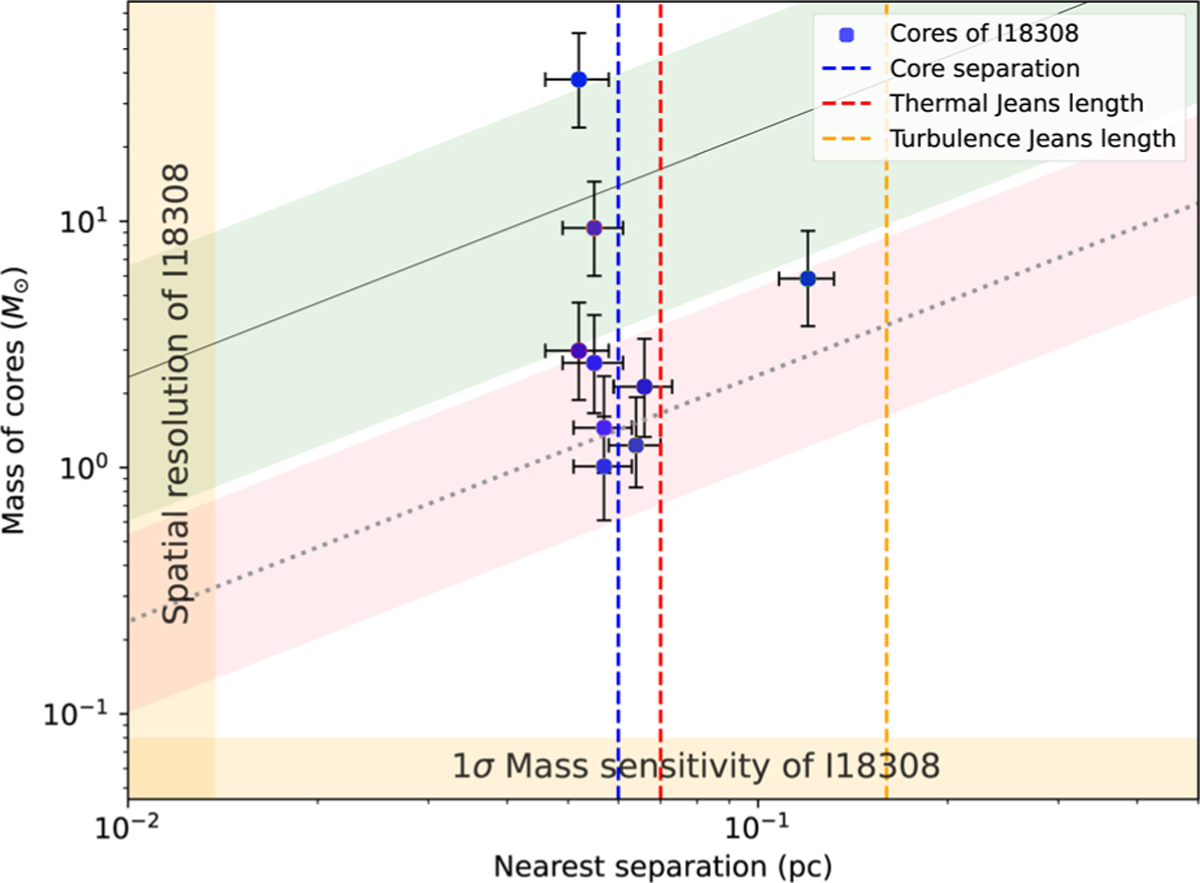
Mass of cores versus their separation in I18308. Blue filled circles represent observed cores. The dotted and solid black lines and the shaded regions are plotted following the outlines described in Wang et al. (2014) and Xu et al. (2023). The dotted black line corresponds to thermal Jeans fragmentation at T = 17.5 K and n = [102, 108] cm-3. The red shaded region was made with the same density range, but for T = [10, 30] K. The solid black line corresponds to turbulent Jeans fragmentation at σtot = 0.78 km s-1 and n = [102,108] cm-3. The green shaded region was made with the same density, but at σtot = [0.50,1.10] km s-1. Vertical blue dashed lines indicate a typical observed core separation of 0.06 pc. Red and orange vertical dashed lines shows the predicted separation for thermal and turbulent Jeans fragmentation models, respectively. Mass sensitivity and spatial sensitivity of ALMA 1.3 mm observations are shown as the orange shaded bands.
Current usage metrics show cumulative count of Article Views (full-text article views including HTML views, PDF and ePub downloads, according to the available data) and Abstracts Views on Vision4Press platform.
Data correspond to usage on the plateform after 2015. The current usage metrics is available 48-96 hours after online publication and is updated daily on week days.
Initial download of the metrics may take a while.