Fig. A
Download original image
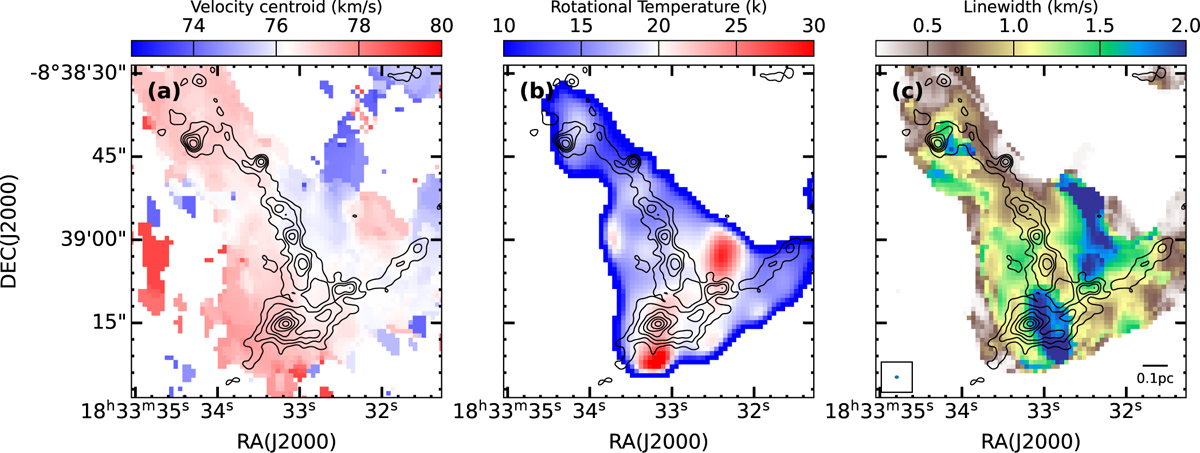
Panel a: Mean velocity (moment 1) map of NH3(1-1) from the VLA 22GHz observations (Lu et al. 2018) overlaid with contours of ALMA 1.3 mm continuum emission. The F1, F2 and hub regions have roughly coherent velocities. Panel b: Rotation temperature map derived from NH3(1-1) observations by the VLA. Panel c: NH3(1-1) line width map. The black contours are at [2, 5, 10, 20, 40, 80, 160] × σ1.3 mm (σ1.3 mm = 0.1 mJy beam-1) and have been smoothed for better visualization. The synthesized beam of O.71″ × O.59″ and a 0.1 pc scale bar are shown in the lower left and lower right corners, respectively.
Current usage metrics show cumulative count of Article Views (full-text article views including HTML views, PDF and ePub downloads, according to the available data) and Abstracts Views on Vision4Press platform.
Data correspond to usage on the plateform after 2015. The current usage metrics is available 48-96 hours after online publication and is updated daily on week days.
Initial download of the metrics may take a while.