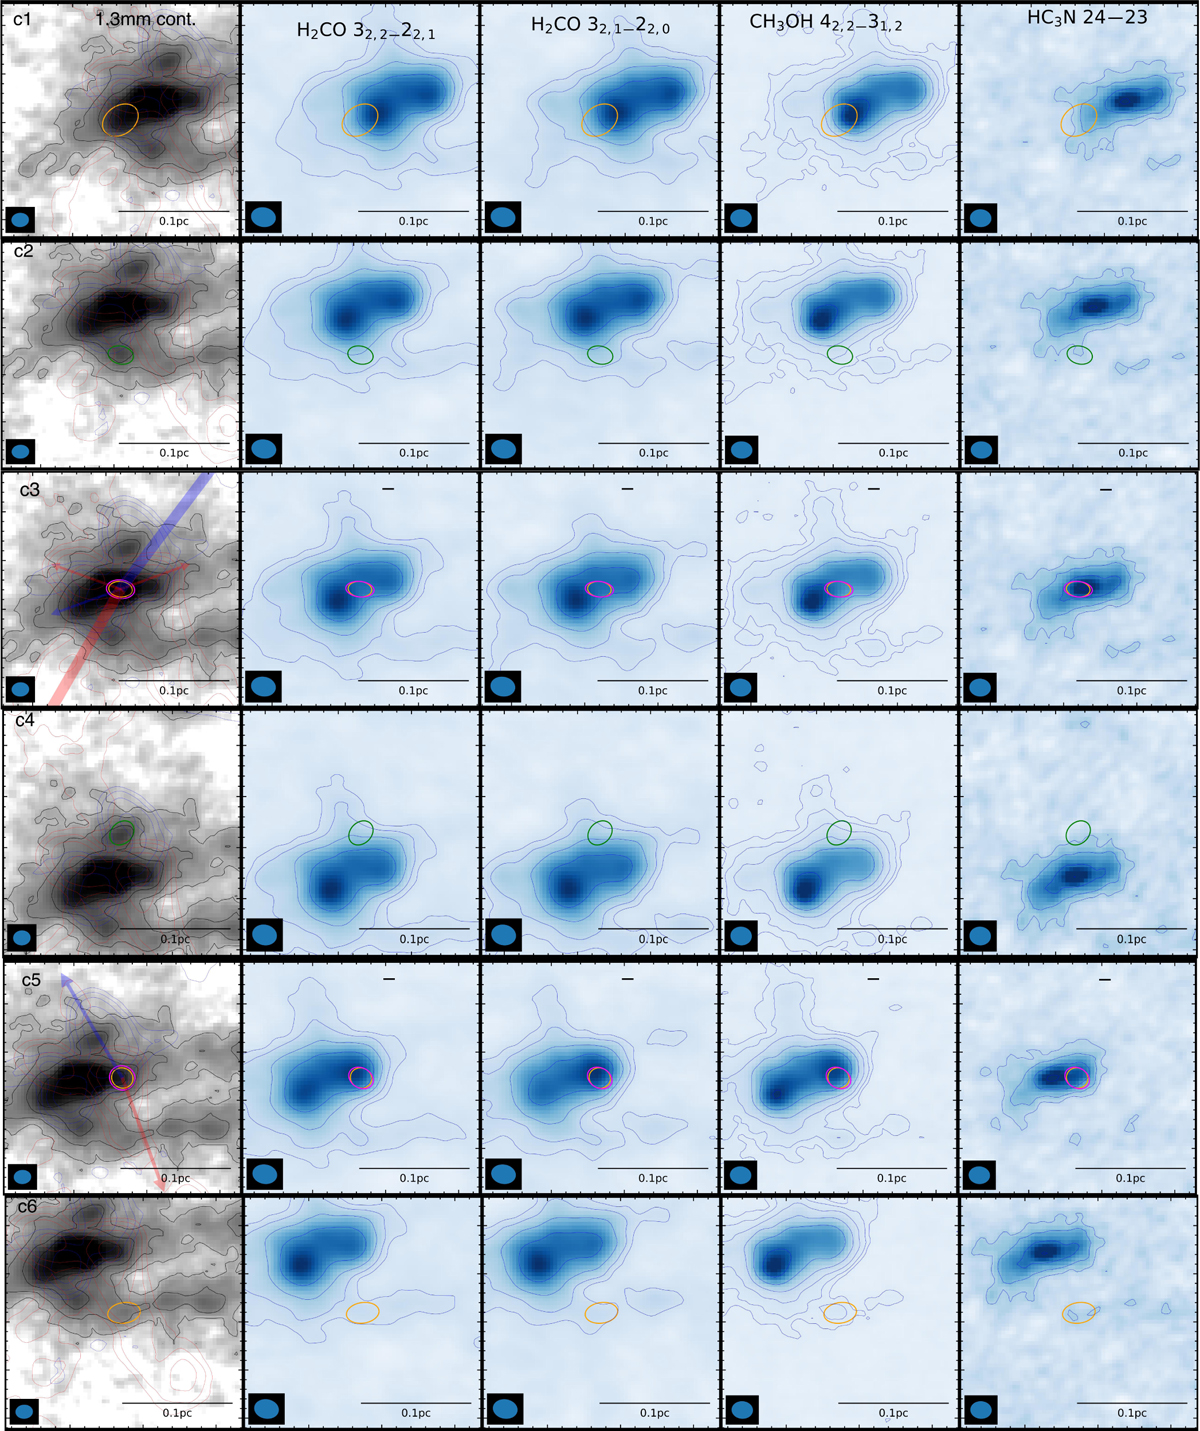
Fig. C.1
Download original image
Classification of core evolutionary stages based on molecular outflow and warm gas tracers for core 1-6. The first column shows the 1.3 mm continuum emission in grey colorscale and black contours, overlaid with the CO 2-1 integration map in blue and red contours. The contour levels for continuum are 1.3×10⁻⁴ Jy beam-1 ×(5, 10, 20, 40, 80, 160). The CO emission is integrated over 5 to 15 km s-1 relative to the systemic velocity for each core for blueshifted and redshifted lobe, respectively, with levels of 0.03 Jy beam-1 km s-1 × (10, 20, 40, 80, 160). The shaded blue and red arrows show the orientation of the identified outflows. The Columns 2-5 show the integration map of different lines over 5 km s-1 interval centered on the systemic velocity, with contour levels σ^×(5, 10, 20, 40, 80). In all panels the core is indicated by one or more ellipse, with green color indicating prestellar, magenta indicating association with molecular outflow, and orange indicating association with “warm core” tracers.
Current usage metrics show cumulative count of Article Views (full-text article views including HTML views, PDF and ePub downloads, according to the available data) and Abstracts Views on Vision4Press platform.
Data correspond to usage on the plateform after 2015. The current usage metrics is available 48-96 hours after online publication and is updated daily on week days.
Initial download of the metrics may take a while.