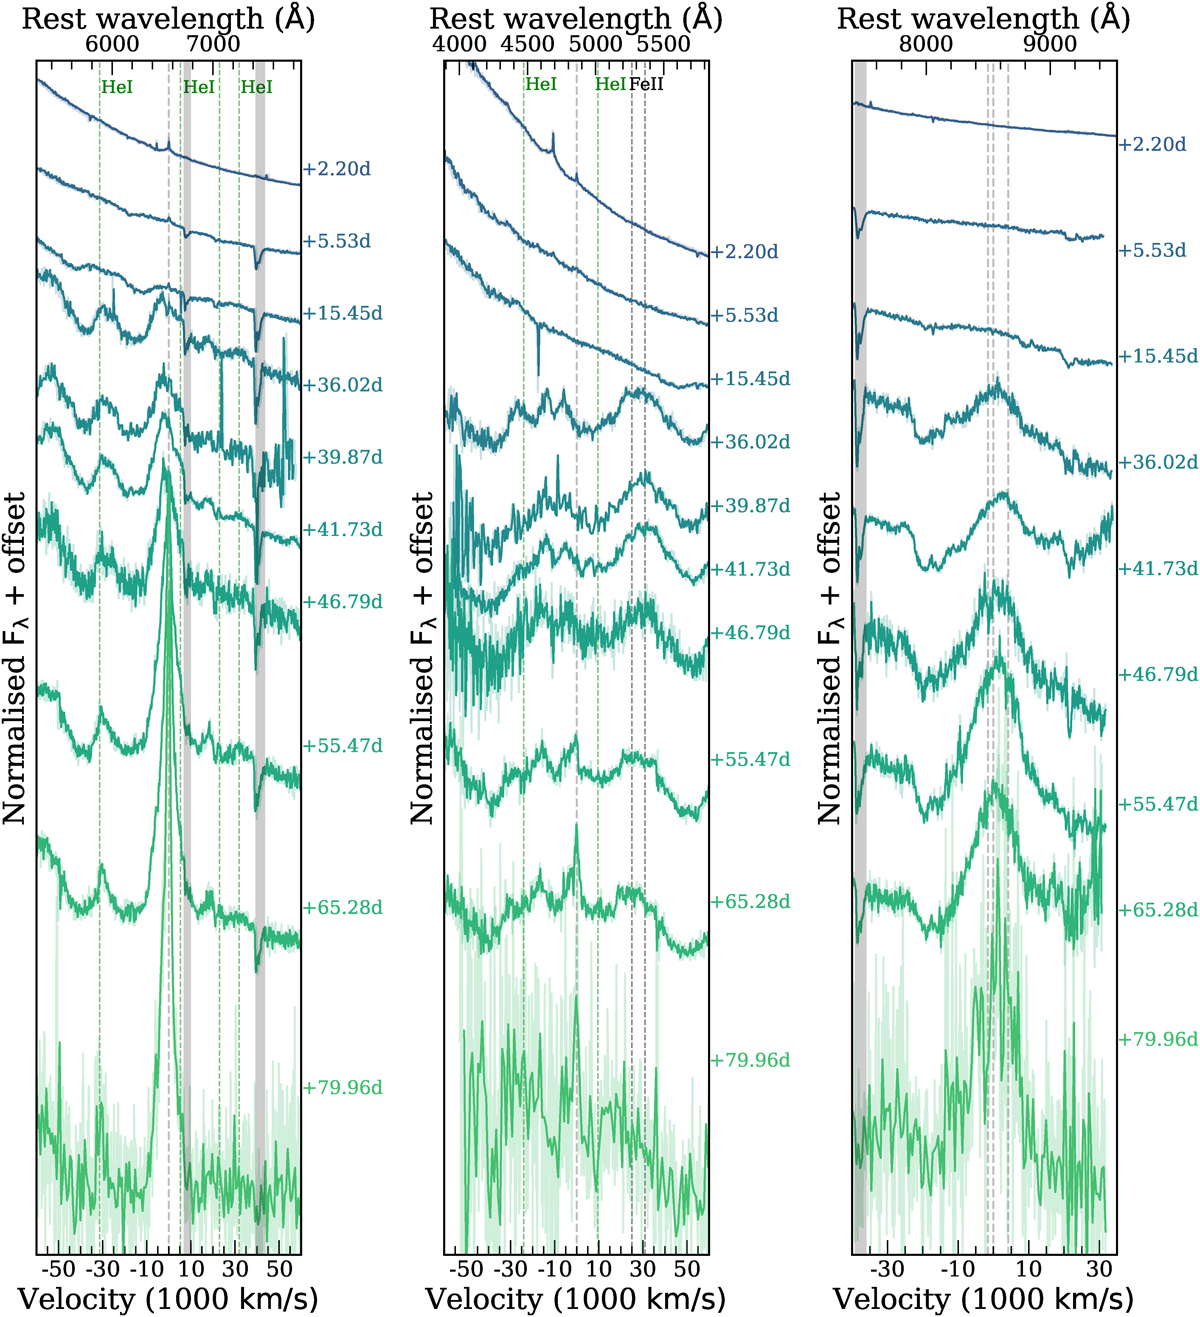
Fig. 11.
Download original image
Evolution of optical spectroscopic lines in velocity space. Left: Region around Hα. Note that for the epochs ≳ + 45 d, we seem to see a break around 5700 Å, with the continuum becoming suddenly stronger blue-wards of that wavelength. Middle: Region around Hβ. Right: Region around Ca II NIR triplet (centred on the middle line but all three lines are shown). The spectra are binned to 5 Å for visual purposes and the original spectra are plotted with lighter colours in the background. The dashed vertical grey line shows the central wavelength. The colours of the vertical lines denote the different elements, green is for helium and black for iron. Although only He Iλ5876 is robustly identified, we mark other helium lines to guide the eye. The telluric features are marked with shaded vertical grey lines.
Current usage metrics show cumulative count of Article Views (full-text article views including HTML views, PDF and ePub downloads, according to the available data) and Abstracts Views on Vision4Press platform.
Data correspond to usage on the plateform after 2015. The current usage metrics is available 48-96 hours after online publication and is updated daily on week days.
Initial download of the metrics may take a while.