Fig. 14.
Download original image
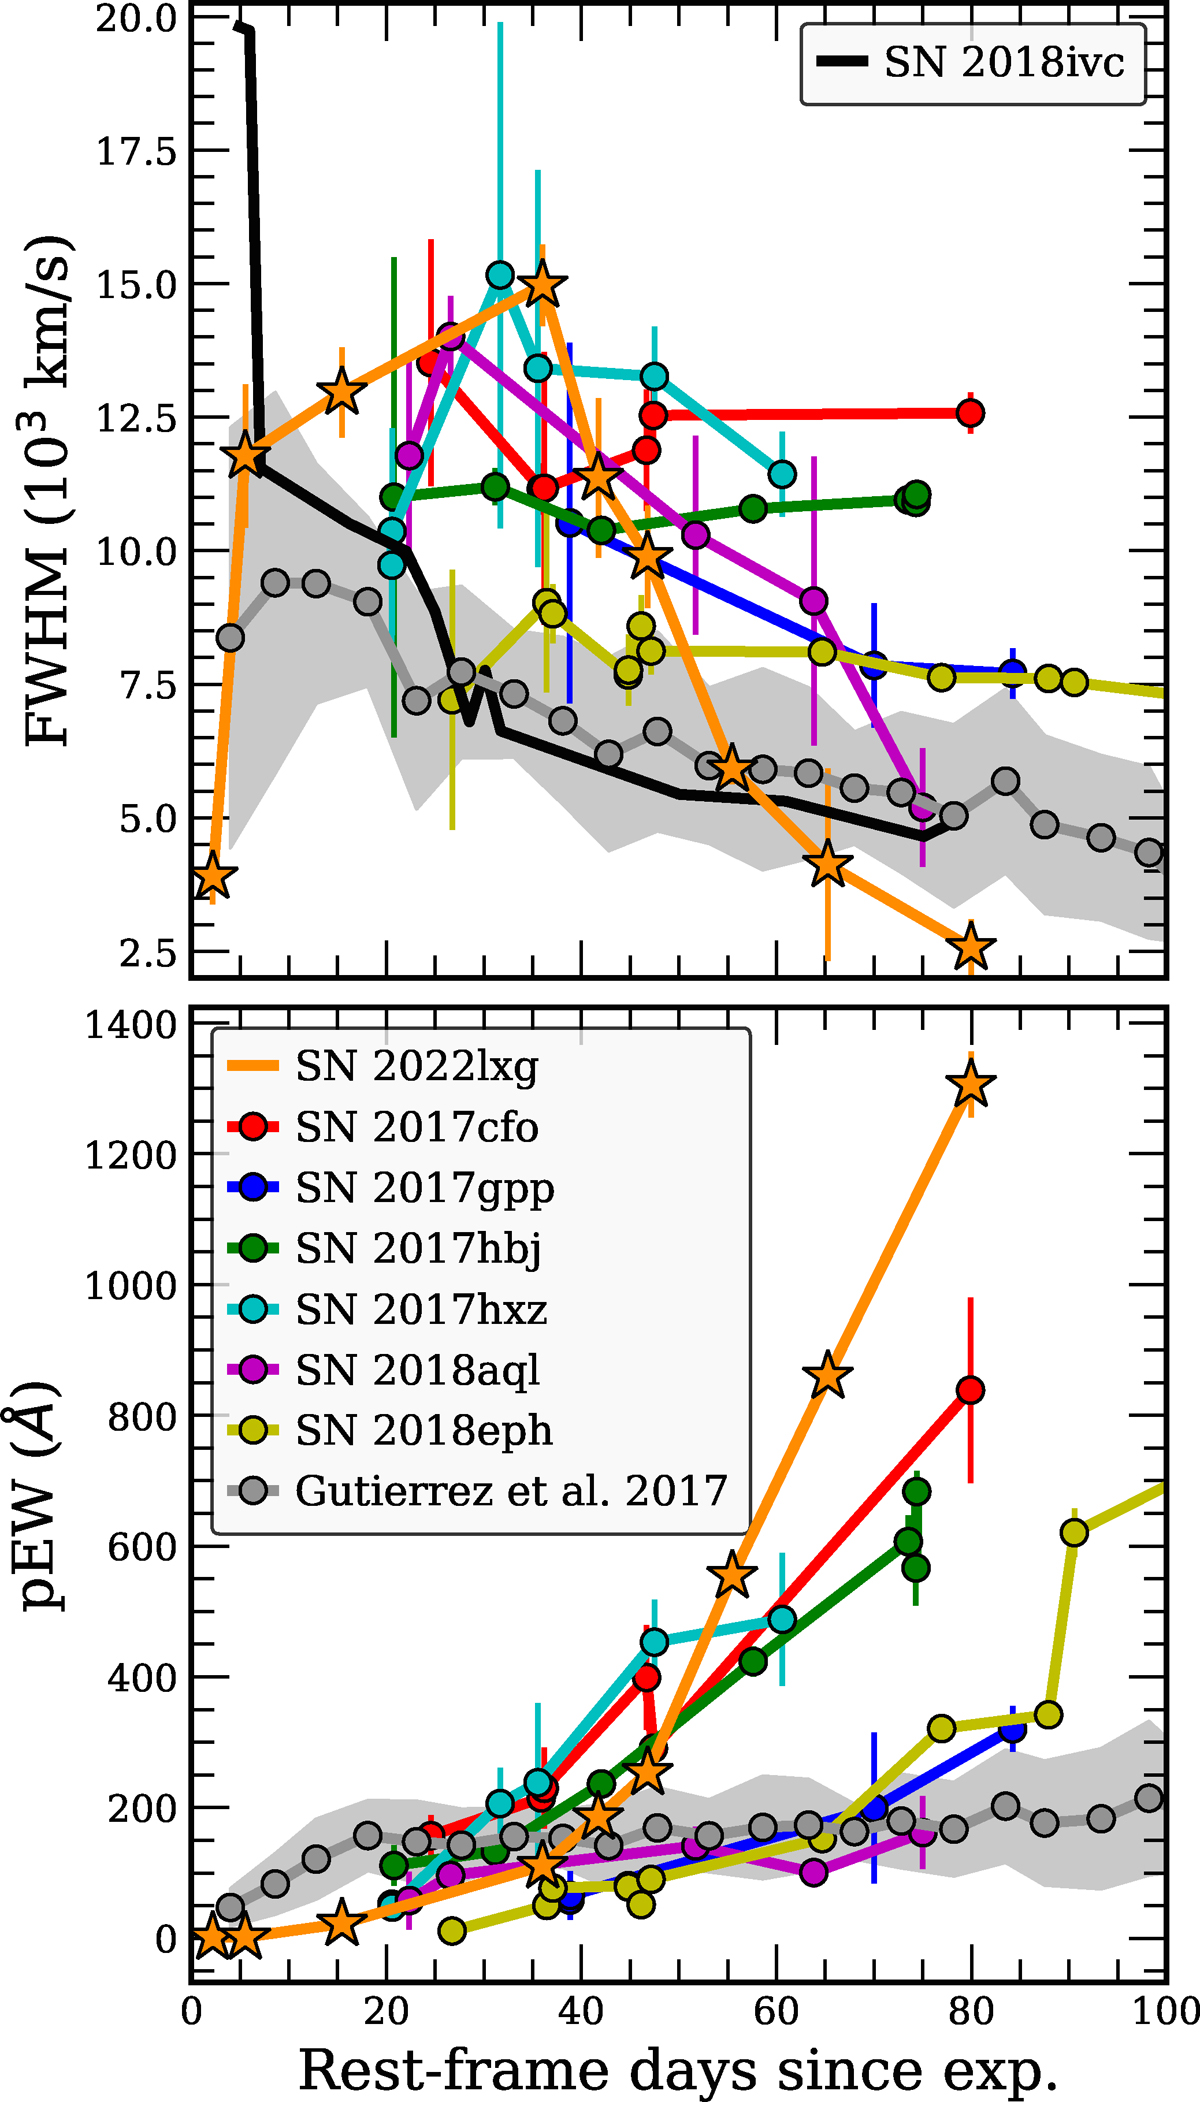
Hα line emission FWHM (top) and pseudo-equivalent width (bottom) compared to other luminous Type II SNe from the P23 sample (adapted from P23). Mean values for regular SNe II from the sample of Gutiérrez et al. (2017) are presented in grey (with the 1σ standard deviation plotted as a shaded region). In the top panel, we also plot the Hα FWHM of SN 2018ivc (from Bostroem et al. 2020).
Current usage metrics show cumulative count of Article Views (full-text article views including HTML views, PDF and ePub downloads, according to the available data) and Abstracts Views on Vision4Press platform.
Data correspond to usage on the plateform after 2015. The current usage metrics is available 48-96 hours after online publication and is updated daily on week days.
Initial download of the metrics may take a while.