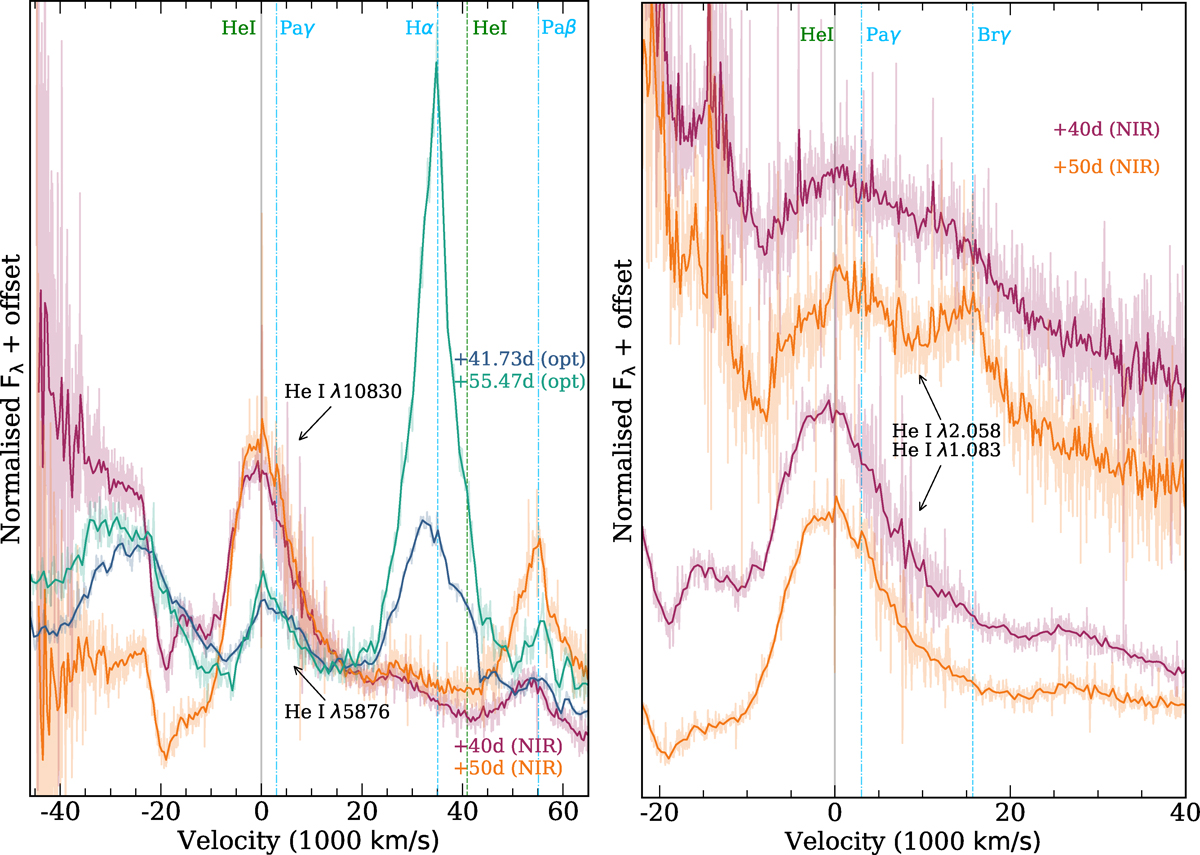
Fig. 16.
Download original image
Evolution of NIR spectroscopic lines in velocity space. The spectra are binned to 5 Å for visual purposes and the original spectra are plotted with lighter colours in the background. The vertical grey line shows the central wavelength. The colours of the vertical lines denote the different elements; green is for helium and cyan for hydrogen. Left: Optical (blue/green colour map) and NIR (red/orange colour map) spectra, centred at He Iλ5876 and λ10830, respectively. The spectra are normalised at ∼16 000 km s−1 red-wards of the central wavelengths. Dashed vertical lines mark elements in the optical while dashed-dotted ones mark elements in the NIR. Right: Evolution of He Iλ10830 (bottom) and He Iλ20581 (top) region of the spectra in velocity space. Dashed vertical lines mark elements in the top spectra while dash-dotted ones mark elements in the bottom ones. Both He I lines show multi-component profiles with absorption components at ∼ − 10 000 and −20 000 km s−1.
Current usage metrics show cumulative count of Article Views (full-text article views including HTML views, PDF and ePub downloads, according to the available data) and Abstracts Views on Vision4Press platform.
Data correspond to usage on the plateform after 2015. The current usage metrics is available 48-96 hours after online publication and is updated daily on week days.
Initial download of the metrics may take a while.