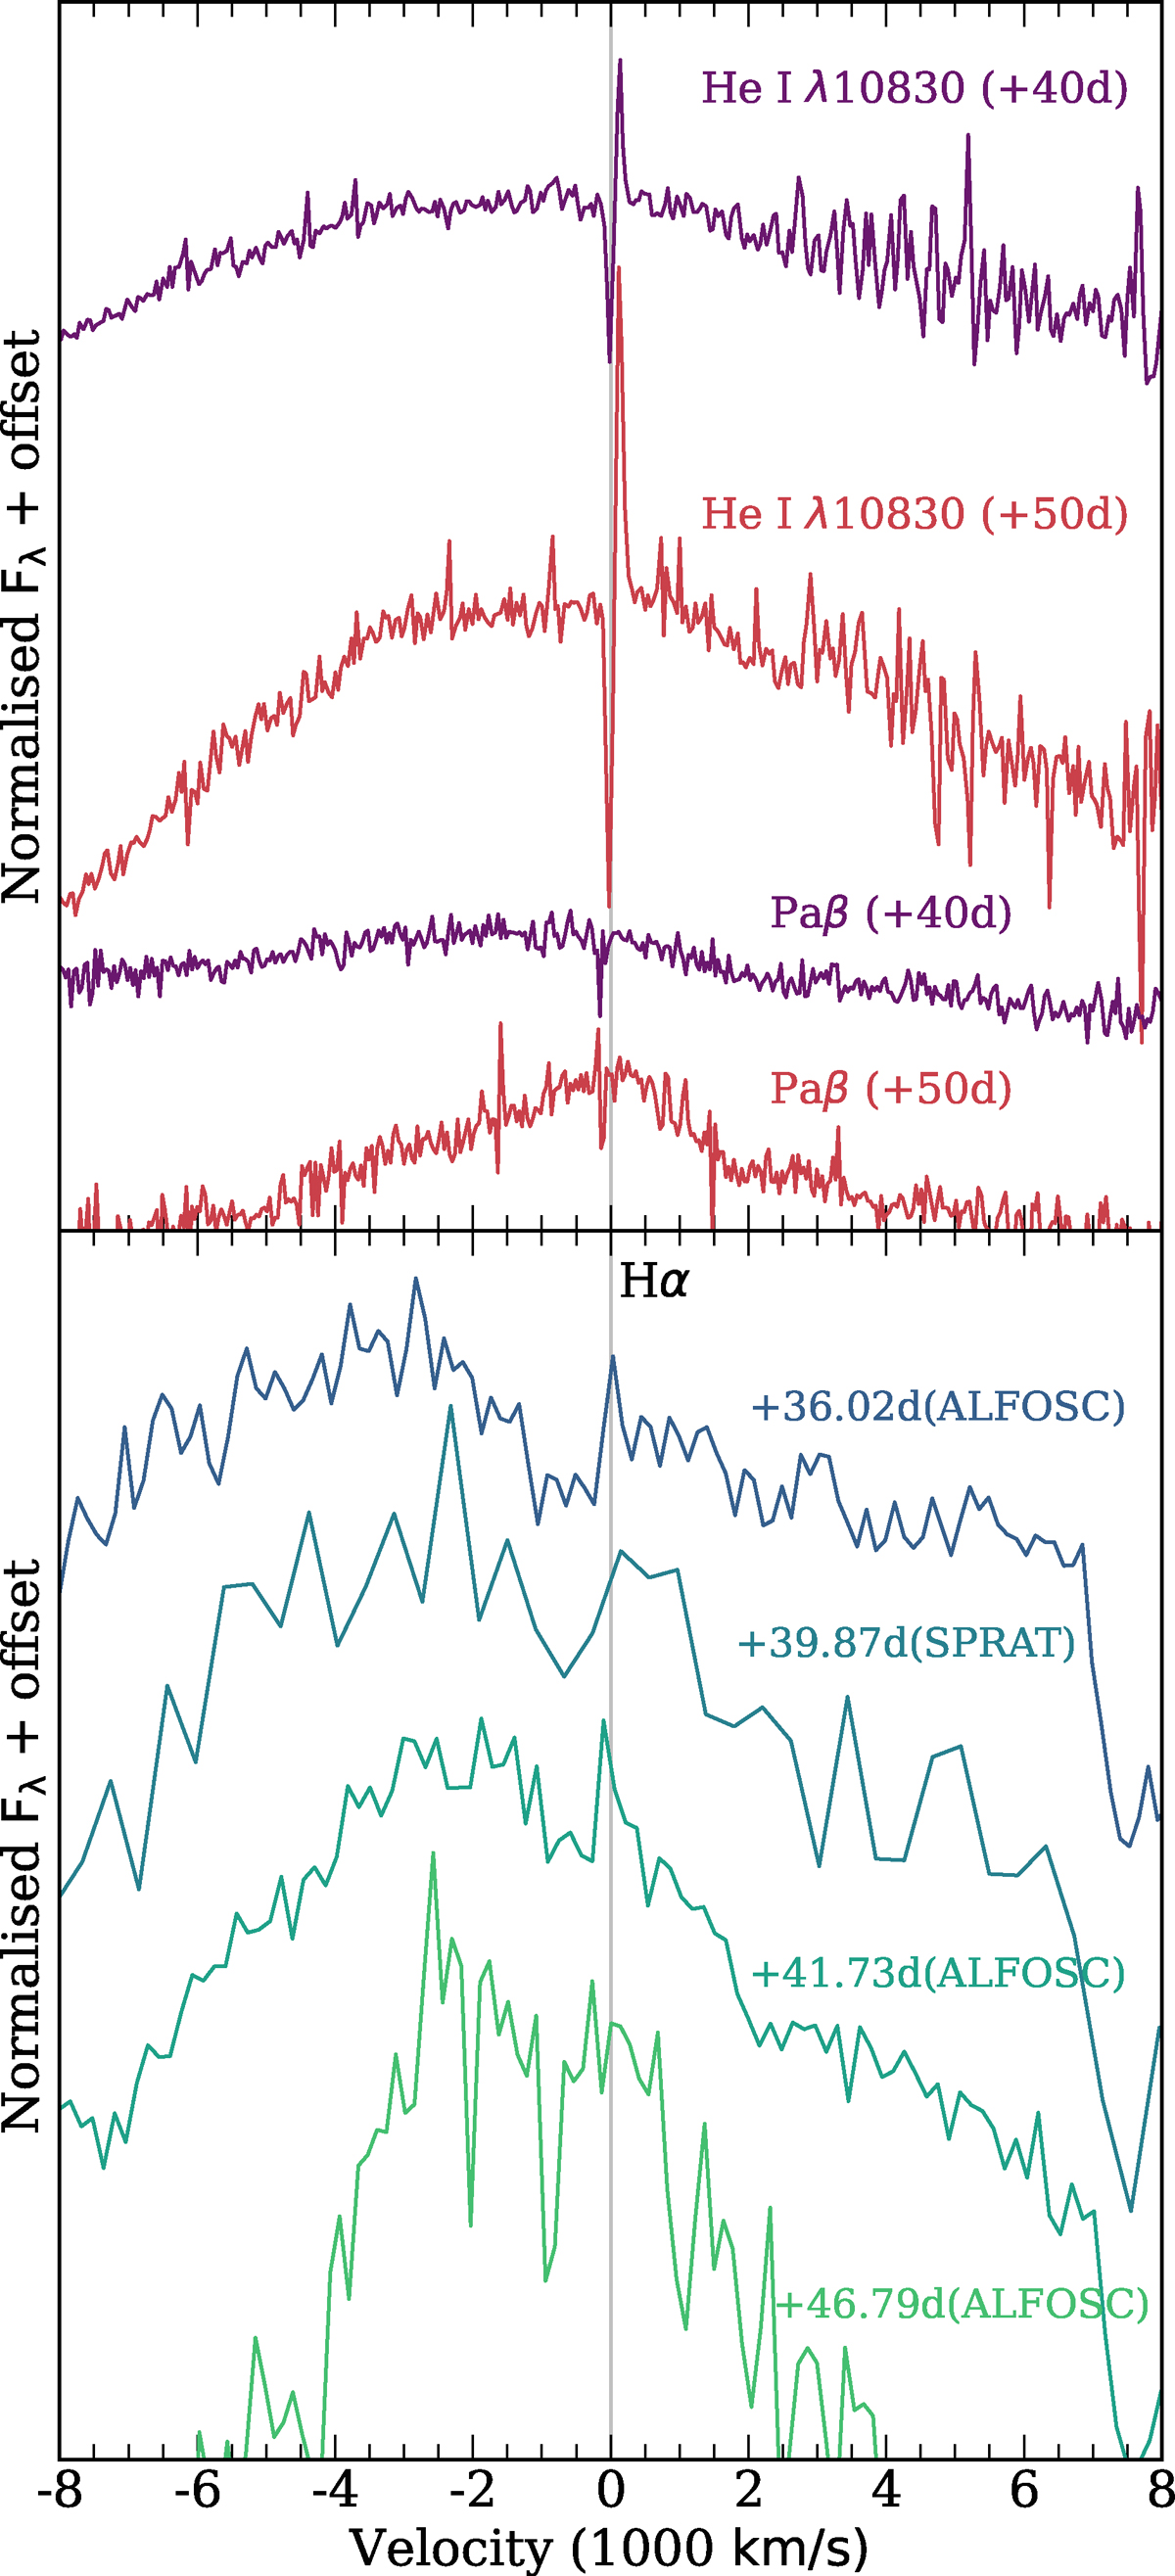
Fig. 17.
Download original image
Narrow P-Cygni profiles in velocity space. Top (LRIS NIR spectra): The two upper spectra clearly show narrow P-Cygni profiles of He I 1.0830 μm with peak to peak separations of ∼150 km s−1, pointing to unshocked CSM. In the two lower (same epoch) spectra, a narrow profile in the Paβ line is tentatively detected. Bottom: Four low-resolution optical spectra centred on Hα spanning ∼10 days.
Current usage metrics show cumulative count of Article Views (full-text article views including HTML views, PDF and ePub downloads, according to the available data) and Abstracts Views on Vision4Press platform.
Data correspond to usage on the plateform after 2015. The current usage metrics is available 48-96 hours after online publication and is updated daily on week days.
Initial download of the metrics may take a while.