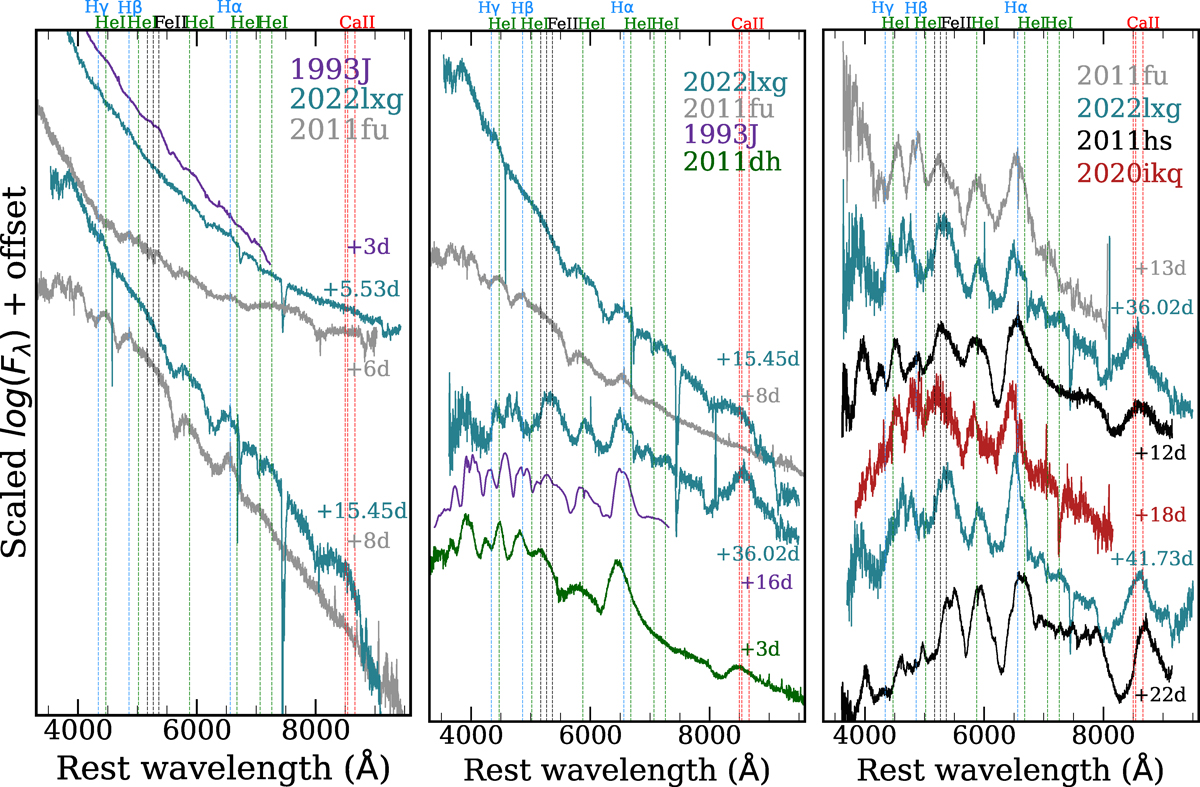
Fig. 19.
Download original image
Spectral comparison of SN 2022lxg to other Type IIb SNe throughout different phases of its evolution. Left: ≲16 d, middle: between ∼(16 − 36) d, right: ≳36 d. The y-axis in the left and middle panel is in log-scale while in the right panel it is linear. Emission lines are marked with vertical dashed lines. There is a clear resemblance between spectra of Type IIb SNe and those of SN 2022lxg throughout different phases of its evolution.
Current usage metrics show cumulative count of Article Views (full-text article views including HTML views, PDF and ePub downloads, according to the available data) and Abstracts Views on Vision4Press platform.
Data correspond to usage on the plateform after 2015. The current usage metrics is available 48-96 hours after online publication and is updated daily on week days.
Initial download of the metrics may take a while.