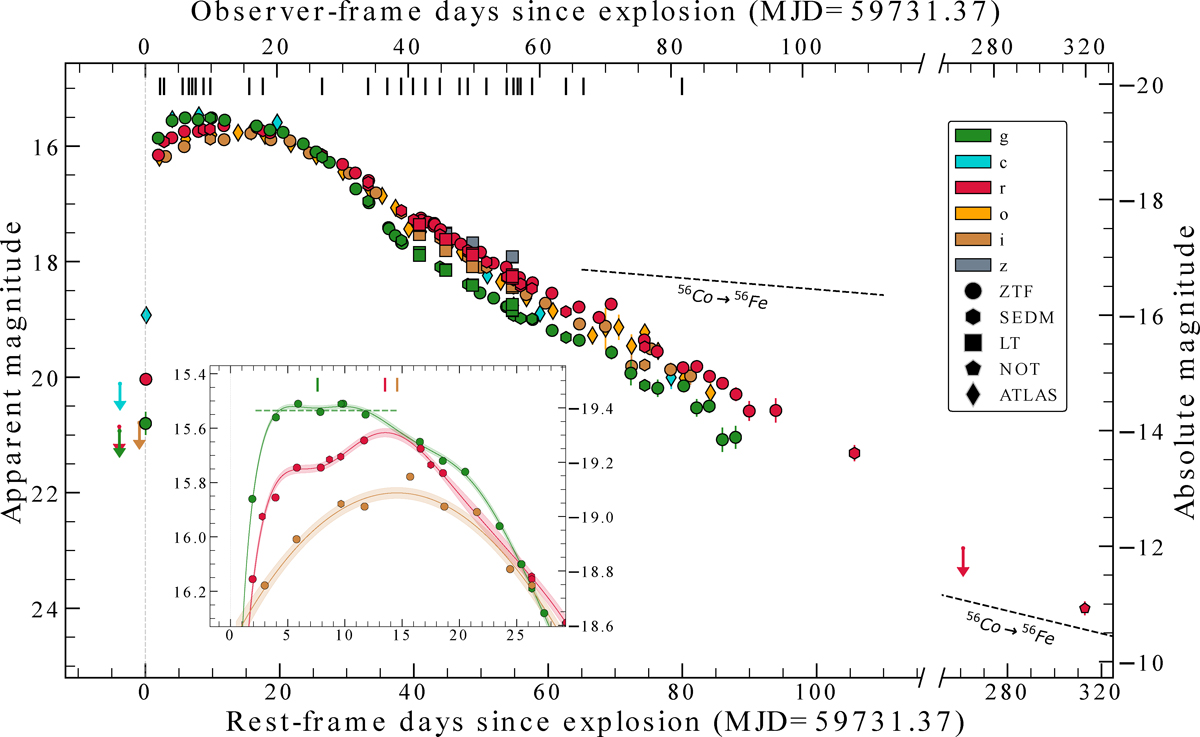
Fig. 2.
Download original image
Light-curves of SN 2022lxg (corrected for MW extinction; E(B − V)MW = 0.059 mag). The explosion epoch is constrained to MJD 59 731.37. The short vertical black dashes denote the epochs of spectroscopy (see Table A.2). Non-detections are shown as small downward-facing arrows. The 56Co decay rate is shown as a dashed black line. Note the break in the x-axis to accommodate the latest epochs. The inset focuses on the phases around the peak light (for the gri bands). The g band seems to plateau for ∼ eight days at its peak (horizontal dashed line is a linear fit to guide the eye), while the r band shows a bump around the time of the start of the g-band plateau, but then continues to rise to its main peak. We show the Gaussian process interpolations used to infer the peak epochs in the gri bands (with 1σ uncertainties as shaded regions), which are marked with short vertical dashes (see also Table 1).
Current usage metrics show cumulative count of Article Views (full-text article views including HTML views, PDF and ePub downloads, according to the available data) and Abstracts Views on Vision4Press platform.
Data correspond to usage on the plateform after 2015. The current usage metrics is available 48-96 hours after online publication and is updated daily on week days.
Initial download of the metrics may take a while.