Fig. 20.
Download original image
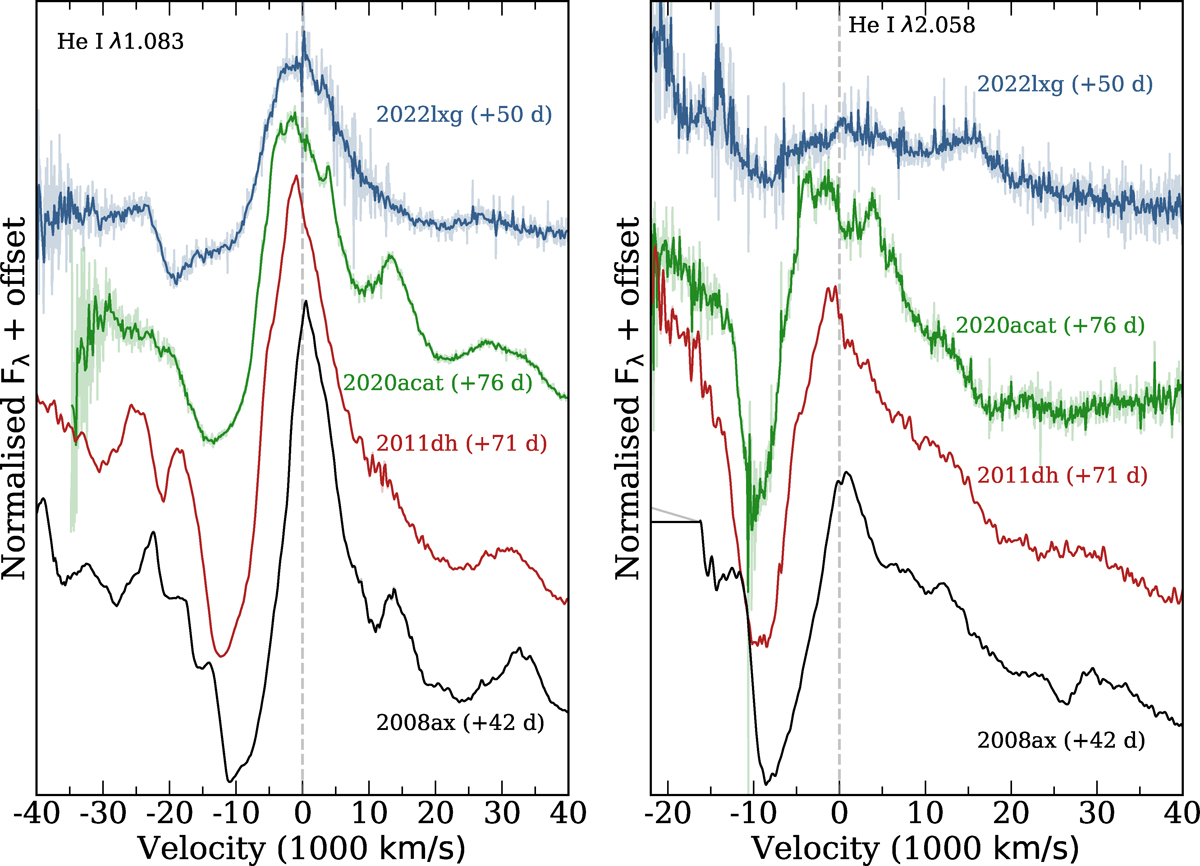
SN 2022lxg He I NIR lines in velocity space and comparison with other Type IIb SNe: SN 2020acat (Medler et al. 2023), SN 2011dh (Ergon et al. 2015), and SN 2008ax (Roming et al. 2009). The spectra are binned to 5 Å for visual purposes and the original spectra are plotted with lighter colours in the background. The vertical grey line shows the central wavelength. Left: He I 1.0830 μm line. The spectra are normalised at ∼20 000 km s−1 red-wards of the central wavelength. Right: He I 2.0581 μm line. The spectra are normalised at ∼35 000 km s−1 red-wards of the central wavelength.
Current usage metrics show cumulative count of Article Views (full-text article views including HTML views, PDF and ePub downloads, according to the available data) and Abstracts Views on Vision4Press platform.
Data correspond to usage on the plateform after 2015. The current usage metrics is available 48-96 hours after online publication and is updated daily on week days.
Initial download of the metrics may take a while.