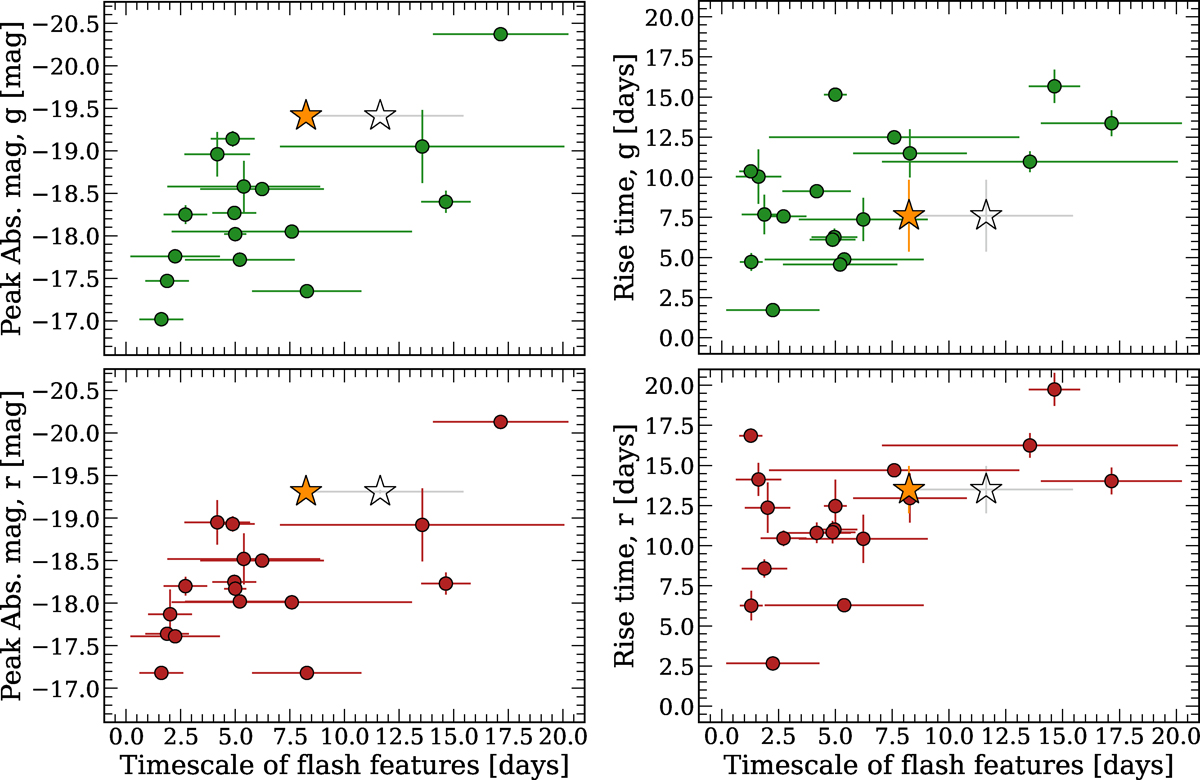
Fig. B.2.
Download original image
Comparison of the timescale of the He II flash-ionisation feature versus the peak absolute magnitude (left panels) and the rise time (right panels), for various SNe (adapted from Bruch et al. 2023). Top panels are in the g band while bottom panels in the r band. SN 2022lxg is shown as a star, where the filled or empty markers denote two potential timescales (8.24 and 11.63 days respectively; see Sect. 3.3.1. The filled circles are a sample of SNe showing flash-ionisation features taken from Bruch et al. (2023).
Current usage metrics show cumulative count of Article Views (full-text article views including HTML views, PDF and ePub downloads, according to the available data) and Abstracts Views on Vision4Press platform.
Data correspond to usage on the plateform after 2015. The current usage metrics is available 48-96 hours after online publication and is updated daily on week days.
Initial download of the metrics may take a while.