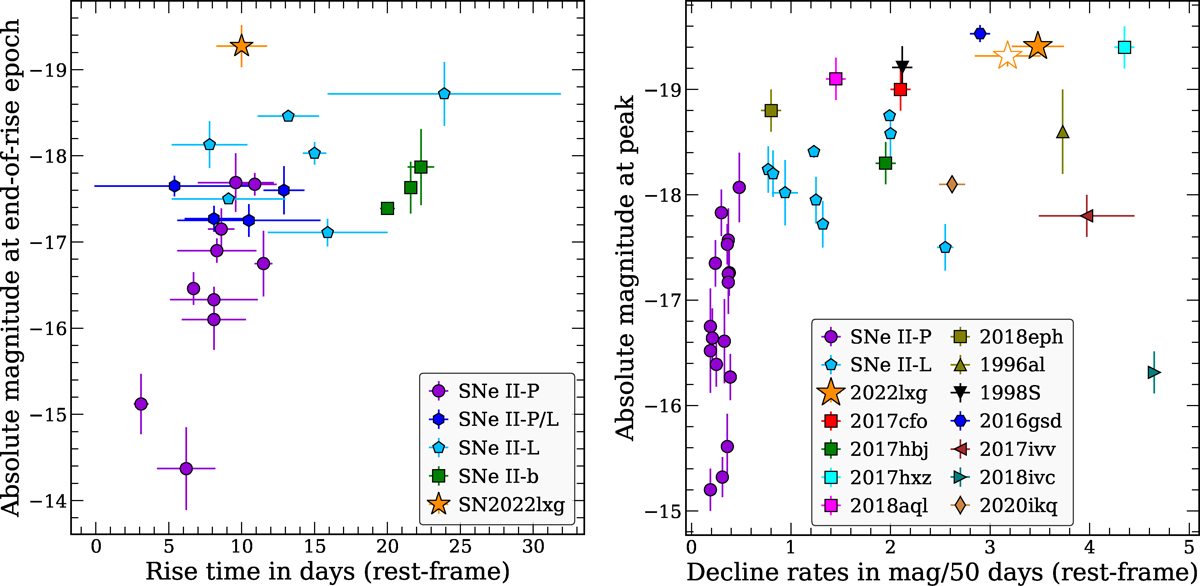
Fig. 5.
Download original image
Light-curve rise and decline timescales against absolute magnitude. Left: Rise time against the Gall et al. (2015) sample measured from the r band. The P23 sample does not have explosion constraints, and is therefore not included here. Right: Decline rate of SN 2022lxg (filled marker in g band, open marker in V band), compared to other luminous Type II SNe from the P23 sample (V band), the Type IIP/IIL sample of Faran et al. (2014) (V band), and several unusual transitional and/or interacting Type II SNe; SN 1996al (Benetti et al. 2016) (B band), SN 1998S (Leonard et al. 2000; Fassia et al. 2000) (V band), SN 2016gsd (Reynolds et al. 2020) (B band), SN 2017ivv (Gutiérrez et al. 2020) (V band), SN 2018ivc (Bostroem et al. 2020; Maeda et al. 2023a; Reguitti et al. 2024) (B band), and the fast and faint Type IIb SN SN 2020ikq (Ho et al. 2023) (g band).
Current usage metrics show cumulative count of Article Views (full-text article views including HTML views, PDF and ePub downloads, according to the available data) and Abstracts Views on Vision4Press platform.
Data correspond to usage on the plateform after 2015. The current usage metrics is available 48-96 hours after online publication and is updated daily on week days.
Initial download of the metrics may take a while.