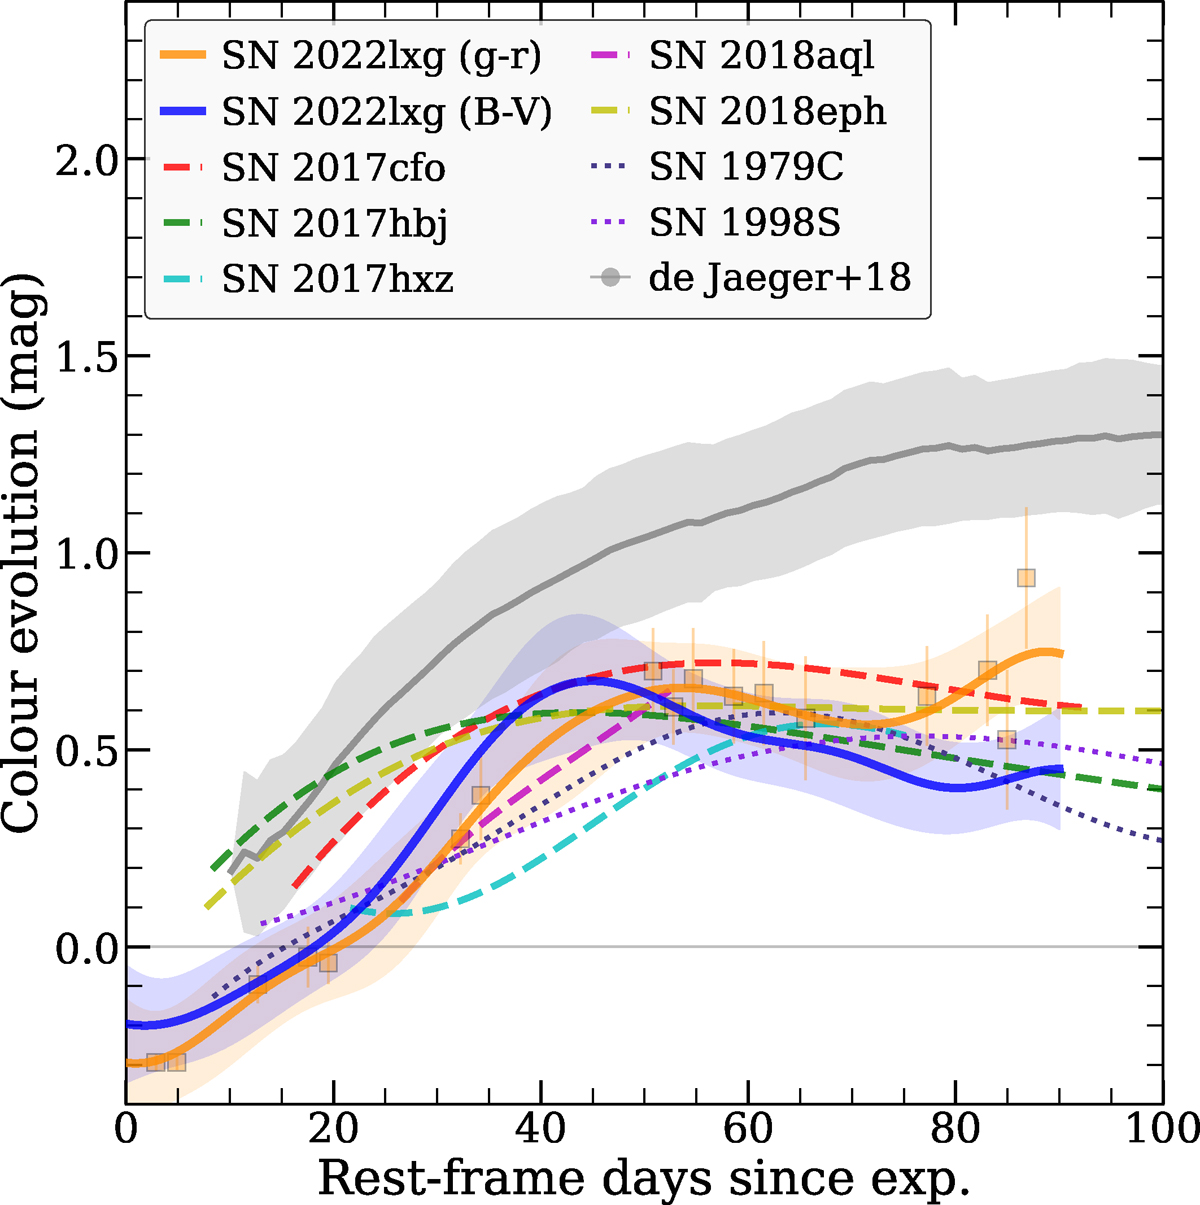
Fig. 7.
Download original image
Gaussian process interpolations of the colours (g − r in orange and B − V in blue) of SN 2022lxg compared to those of other luminous Type II SNe from the P23 sample. We overplot the actual measured g − r colours of SN 2022lxg with faint squares and the 1σ uncertainties of the interpolations as shaded lines. Mean values of B − V colours of the sample of SNe II studied by de Jaeger et al. (2018) are presented in grey for comparison (with the 1σ standard deviation plotted as a shaded region).
Current usage metrics show cumulative count of Article Views (full-text article views including HTML views, PDF and ePub downloads, according to the available data) and Abstracts Views on Vision4Press platform.
Data correspond to usage on the plateform after 2015. The current usage metrics is available 48-96 hours after online publication and is updated daily on week days.
Initial download of the metrics may take a while.