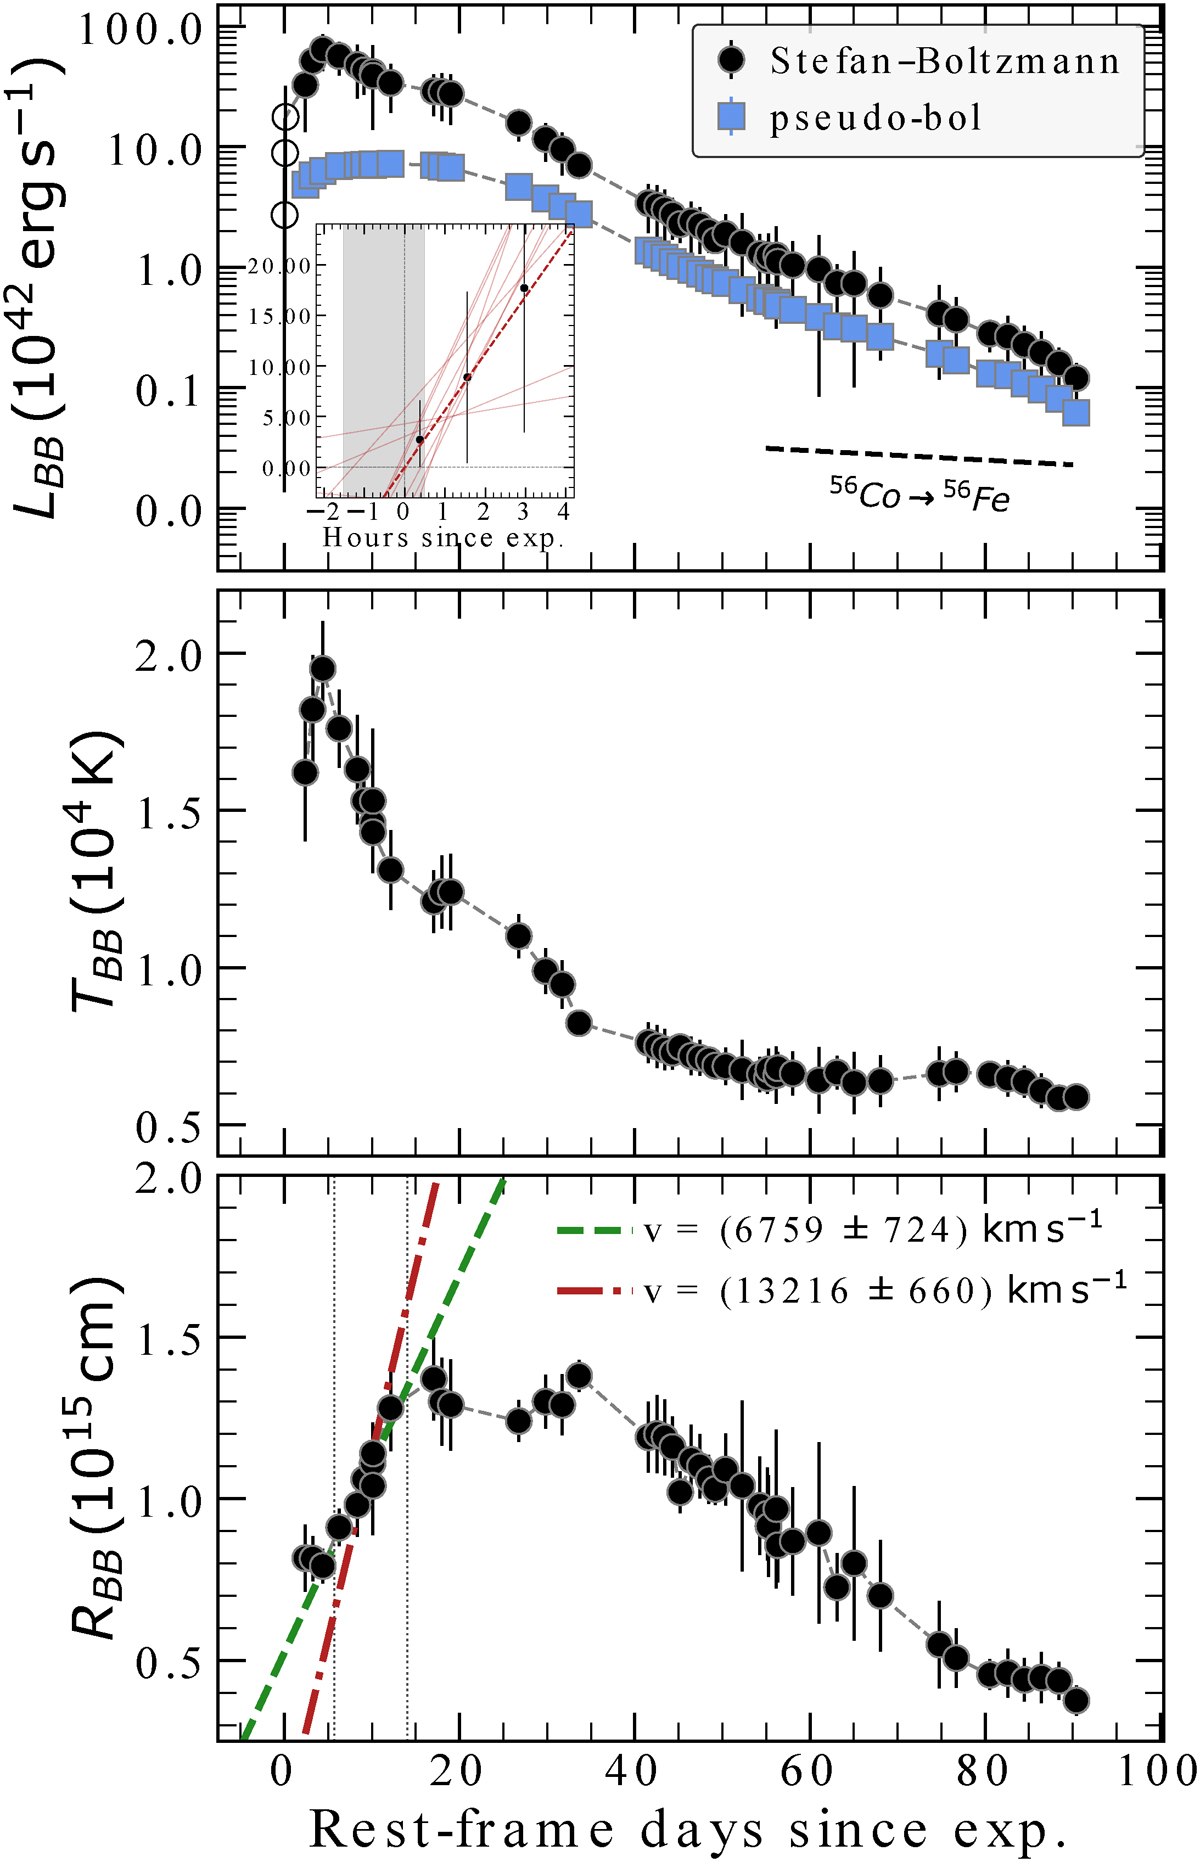
Fig. 8.
Download original image
Pseudo-bolometric gcroiz light-curve of SN 2022lxg (top panel) and blackbody temperature and radius evolution (middle and bottom panels) derived from blackbody fits to the SEDs. The bolometric luminosity derived with the Stefan-Boltzmann law is also shown in the top panel, with the open markers showing the luminosity estimates of the early first three detections (within three hours from the explosion), converted from temperature to luminosity using the Stefan-Boltzmann law. The inset zooms-in on those points where we plot in red ten random samples from the posterior distribution of linear Monte Carlo fits. The vertical grey line denotes the explosion epoch estimate (median of the posterior distribution) while the shaded grey region denotes the uncertainty on the estimate (16th and 84th percentiles). In the bottom panel, we show linear fits to the rising part of the expanding photosphere (the exact fitted region is within the vertical dotted lines), the dash-dotted red fit has R(t = 0) fixed at zero, while the dashed green one does not.
Current usage metrics show cumulative count of Article Views (full-text article views including HTML views, PDF and ePub downloads, according to the available data) and Abstracts Views on Vision4Press platform.
Data correspond to usage on the plateform after 2015. The current usage metrics is available 48-96 hours after online publication and is updated daily on week days.
Initial download of the metrics may take a while.