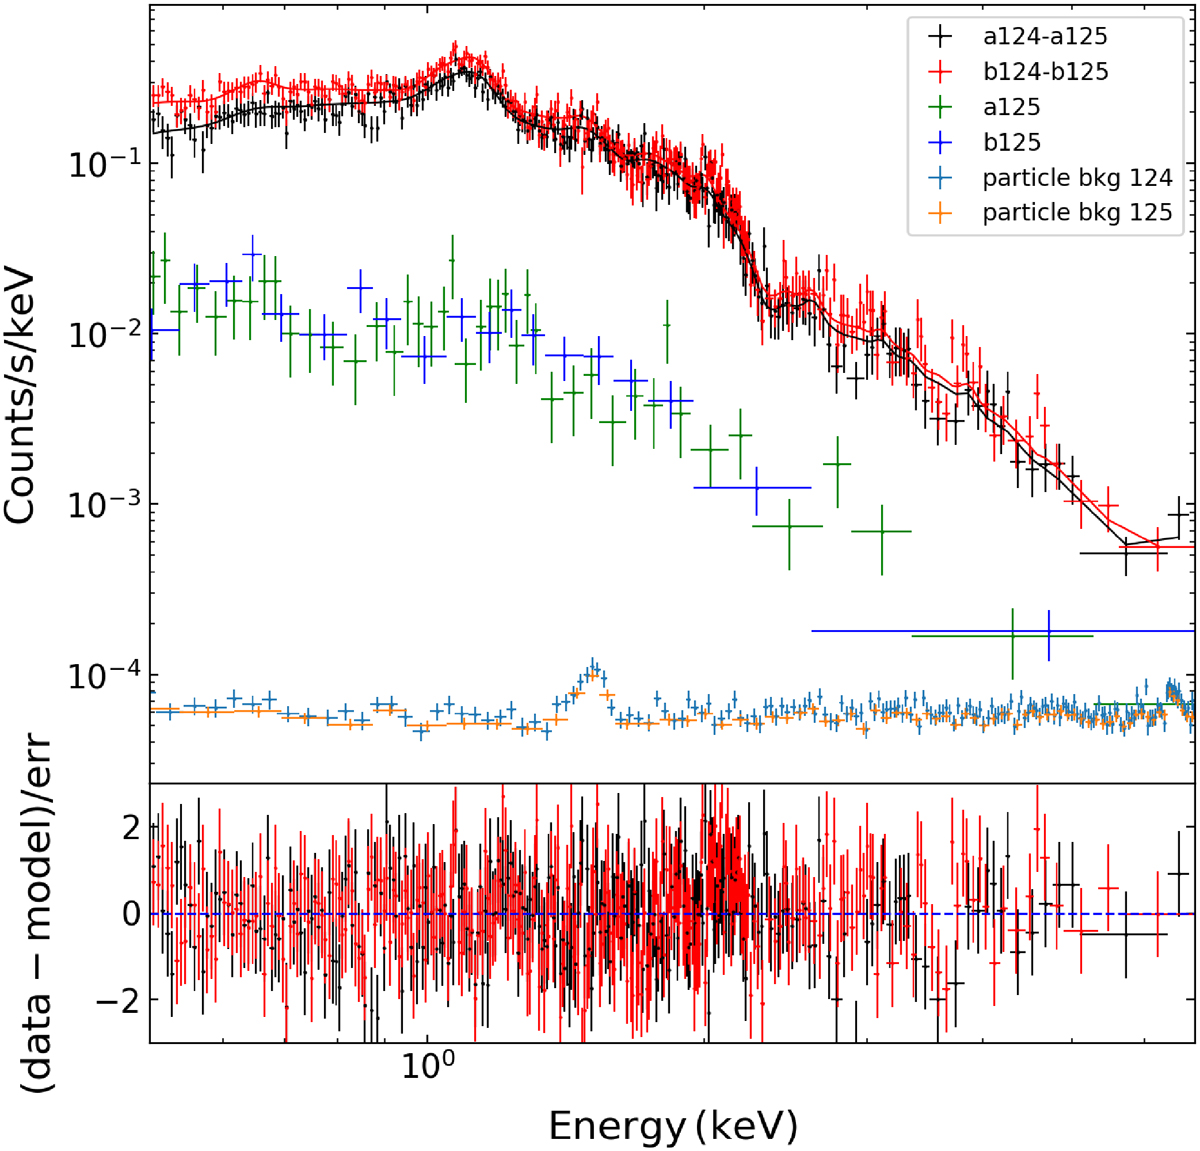
Fig. 5.
Download original image
EP-FXT spectrum from a contour-binning region in M87. The black and red points represent the spectral data from FXT-A and FXT-B for ObsID 13600005124, with the corresponding background from ObsID 13600005125 subtracted, and the solid line represents the best-fit model. The green and blue points represent the spectra from FXT-A and FXT-B for ObsID 13600005125, respectively. The light cyan and orange points represent the particle backgrounds for ObsIDs 13600005124 and 13600005125, respectively.
Current usage metrics show cumulative count of Article Views (full-text article views including HTML views, PDF and ePub downloads, according to the available data) and Abstracts Views on Vision4Press platform.
Data correspond to usage on the plateform after 2015. The current usage metrics is available 48-96 hours after online publication and is updated daily on week days.
Initial download of the metrics may take a while.