| Issue |
A&A
Volume 700, August 2025
|
|
|---|---|---|
| Article Number | A248 | |
| Number of page(s) | 9 | |
| Section | Cosmology (including clusters of galaxies) | |
| DOI | https://doi.org/10.1051/0004-6361/202554719 | |
| Published online | 26 August 2025 | |
Imaging-spectroscopy diagnosis of the giant sloshing spiral in the Virgo cluster with the Einstein Probe Follow-up X-ray Telescope
1
State Key Laboratory of Particle Astrophysics, Institute of High Energy Physics, Chinese Academy of Sciences, Beijing 100049, China
2
School of Physics and Astronomy, Beijing Normal University, Beijing 100875, China
3
Department of Astronomy, Tsinghua University, Beijing 100084, China
4
Max Planck Institute for Extraterrestrial Physics, Giessenbachstrasse 1, 85748 Garching, Germany
5
Institute for Frontiers in Astronomy and Astrophysics, Beijing Normal University, Beijing 102206, China
6
National Astronomical Observatories, Chinese Academy of Sciences, 20A Datun Road, Beijing 100101, China
7
Department of Astronomy, Xiamen University, Xiamen 361005, China
8
School of Astronomy and Space Science, University of Chinese Academy of Sciences, 19A Yuquan Road, Beijing 100049, China
9
Computing Center, Institute of High Energy Physics, Chinese Academy of Sciences, Beijing 100049, China
⋆ Corresponding author: This email address is being protected from spambots. You need JavaScript enabled to view it.
Received:
24
March
2025
Accepted:
5
July
2025
Abstract
We performed deep X-ray observations of the Virgo cluster using the Einstein Probe Follow-up X-ray Telescope (EP-FXT) with a total exposure of 295 ks. Taking advantage of the large field of view (FoV) and low particle background of EP-FXT, the image reveals a giant spiral feature connecting the cold fronts in the northwest and southeast, forming a coherent structure consistent with previous XMM-Newton and Suzaku findings. Furthermore, we present two-dimensional maps of the temperature, metallicity, and entropy in the Virgo cluster that cover a FoV of approximately 28.5′. These maps clearly depict a spiral structure that is characterized by high density, low temperature, high metallicity, and low entropy. These results support the scenario in which the spiral morphology originates from gas sloshing that is induced by a minor merger. In addition, the temperatures measured with EP-FXT are reasonably consistent with those obtained from XMM-Newton within the uncertainties.
Key words: Galaxy: structure / galaxies: clusters: intracluster medium / galaxies: structure
© The Authors 2025
 Open Access article, published by EDP Sciences, under the terms of the Creative Commons Attribution License (https://creativecommons.org/licenses/by/4.0), which permits unrestricted use, distribution, and reproduction in any medium, provided the original work is properly cited.
This article is published in open access under the Subscribe to Open model. This email address is being protected from spambots. You need JavaScript enabled to view it. to support open access publication.
1. Introduction
Galaxy clusters are composed of hundreds to thousands of galaxies that are bound by gravity. They are the largest building blocks of the cosmic web (Kravtsov & Borgani 2012; Vikhlinin et al. 2014). The X-ray radiation from clusters predominantly arises from the intracluster medium (ICM), which is a hot, diffuse plasma with a wealth of complex structures, such as shocks, bubbles, and cold fronts that trace past and ongoing violent dynamic processes in the system (Markevitch & Vikhlinin 2007). Cold fronts are distinguished from shock fronts. They are sharp interfaces that separate brighter, denser, and cooler gases from the other side with a continuous pressure across the interface (Owers et al. 2009; de Plaa et al. 2010; Ettori et al. 2013; Ghizzardi et al. 2010).
Cold fronts or even spectacular spiral structures have been widely identified in nearby clusters (Keshet 2012). It is proposed that the cold front originates in a displacement of cold gas at the cluster core, triggered by gravitational perturbations, such as those induced by minor mergers (Ascasibar & Markevitch 2006; ZuHone et al. 2010; Rossetti 2013; Markevitch et al. 2001; Roediger et al. 2011; Markevitch & Vikhlinin 2007). In relaxed galaxy clusters, minor mergers disturb the central gas, initiating sloshing motions that produce multiple cold fronts at various locations over time (Roediger et al. 2011; Liu et al. 2018). These sloshing motions can evolve into intricate spiral structures that are visible in X-ray images as concentric edges (Ascasibar & Markevitch 2006; Sonkamble et al. 2024), for instance, A795 (Kadam et al. 2024a). Alternative explanations for the sloshing-induced spiral include two-phase gas flows with differing velocities (Keshet 2012) and the rotational motion of an in-falling gas flow around a moving brightest cluster galaxy (BCG) due to the Coriolis force (Inoue 2022).
Despite the detection of a variety of cold fronts, those that manifest themselves as a clear and complete spiral structure are rare, mainly because current X-ray telescopes cannot easily reveal large-scale and low-contrast structures. So far, remarkable examples include those seen in A496, A795, A1775, A2029, A2052, A2566, A2657, Centaurus, NGC 7618/UGC 12491, Perseus, and Virgo (Walker et al. 2017; Fabian et al. 2006; Roediger et al. 2012; Ghizzardi et al. 2014; Kadam et al. 2024a,b; Botteon et al. 2024, 2021; Machacek et al. 2023; Blanton et al. 2011; Paterno-Mahler et al. 2013; Sanders et al. 2016a), which were mainly found in mosaic observations with XMM-Newton1 and Chandra2. The detection and detailed investigations of large-scale sloshing spirals are essential for advancing our understanding of the physical mechanism of sloshing and of the dynamical evolution of galaxy clusters.
Because of its proximity, the Virgo cluster is an excellent target for in-depth studies on this topic. Within the Virgo cluster, M87 stands out as the largest and brightest elliptical galaxy, with a redshift of 0.0042. It has been extensively studied at multiple wavelengths, which provided valuable insights into the interaction between its central supermassive black hole (3.2 × 10⁹ M⊙ within 3.5 pc of its center) and the surrounding ICM (Harms et al. 1994; Simionescu et al. 2010; Bahcall & Sarazin 1977). Early X-ray observations with ROSAT3, XMM-Newton, and Chandra have provided definitive evidence that the feedback of an active galactic nucleus (AGN) surrounds the central galaxy M87 (Böhringer et al. 2001; Molendi & Gastaldello 2001; Bohringer et al. 1995; Forman et al. 2005; Sanders et al. 2016b). In addition, several distinct structures within M87 have been discovered, such as two X-ray arms, bubbles, and cavities (Sanders et al. 2016b). X-ray observations have revealed multiple sloshing cold fronts in the Virgo cluster. XMM-Newton identified cold fronts at 33 kpc and 90 kpc and revealed a spiral structure that extends to approximately 200 kpc (Simionescu et al. 2010; Roediger et al. 2011). Suzaku4 later detected additional outer cold fronts at 233 and 280 kpc and carried out detailed radial analyses of their thermodynamic properties, which further confirmed that gas sloshing extends well beyond the core of the cluster (Simionescu et al. 2017). Although previous studies have mapped the two-dimensional thermodynamic properties of the ICM in the central region of M87 (Gatuzz et al. 2022), the temperature, entropy, and metallicity distributions in the outer spiral arm remain poorly characterized. While eROSITA5 is capable of covering the extended spiral structure in the outskirts of Virgo (McCall et al. 2024), its relatively short exposure time has limited a detailed analysis of the associated physical properties. To more comprehensively investigate the role of gas sloshing and cold fronts in the outskirts of galaxy clusters, it is important to conduct observations with an X-ray telescope that offers a larger FoV and sufficient sensitivity.
Benefiting from its large FoV and low particle background, the Follow-up X-ray Telescope on board the Einstein Probe (EP-FXT) (Yuan et al. 2022, 2025) is well suited for detecting large-scale extended structures with a low surface brightness. We present deep EP-FXT observations of the Virgo cluster. Our data support the detection of the giant sloshing spiral and enable spatially resolved analyses of its thermodynamic properties. The paper is organized as follows. We describe the observations in Sect. 2, and we present the imaging results in Sect. 3 and the spatially resolved spectral results in Sect. 4. We discuss the physical implications in Sect. 5 and summarize our findings in Sect. 6.
2. Observations and data reduction
EP-FXT is one of the two payloads on board the EP mission, which is an X-ray telescope that is a result of China-Europe collaboration and was launched on January 9, 2024. EP-FXT is capable of conducting detailed observations of targets triggered by the Wide-field X-ray Telescope (EP-WXT) and of preselected targets designated from the ground. EP-FXT comprises two identical modules, FXT-A and FXT-B, that are each equipped with Wolter-I type X-ray optics featuring a focal length of 1.6 m and 54 nested gold-coated nickel mirror shells. These modules are paired with PNCCD detectors as focal-plane instruments and enable precise measurements of the photon energy, position, and timing (Cui et al. 2023). The device features a pixel array of 384 × 384, with an angular resolution of approximately 9.6″ per pixel. EP-FXT covers an energy range of 0.3–10 keV, with a FoV of 1° ×1°, a spatial resolution of 22″ in terms of half-power diameter (HPD), and an effective area of approximately 300 cm2 at 1 keV (one unit). In addition, the particle background of EP-FXT is about one-fifth of that of eROSITA, and its low background characteristics make it particularly well suited for observing low-brightness diffuse emissions (Zhang et al. 2022).
As the first-light object and a calibration source for EP-FXT, the Virgo cluster and its central galaxy M87 have been extensively observed. The large FoV of EP-FXT means that a single observation can effectively cover the outskirts of M87. All observations were performed in full-frame (FF) mode using either the thin or medium filter. Three of the FXT-B observations were conducted in closed mode, which rendered the corresponding data unusable. As a result, only FXT-A data were used. This resulted in a total effective exposure time of 295 ks (see the observational log in Table 1).
EP-FXT observations of the Virgo cluster.
We used the latest version 1.10 of the Follow-up X-ray Telescope Data Analysis Software (FXTDAS)6 developed at the EP-FXT Science Center for data reduction (Zhao et al. 2025). New event files were generated through the fxtchain pipeline, and the out-of-time events were identified using fxtootest, which were then removed from the data with ftimgcalc7. When high-energy cosmic rays pass through space telescopes, they release energy onto the detectors, which excites fluorescence lines that are not modulated by the vignetting effect. To correct for this background contribution, fxtbkggen was used to generate particle backgrounds for each observation. We removed the particle background from each image and then used the reproject_image8 tool to merge all exposure images along with their corresponding particle background-subtracted images. Subsequently, we used the merged exposure maps to correct for the vignetting effect in the particle background-subtracted X-ray images. Following this, the data from ObsID 13600005125, without particle background, were selected as the reference for the diffuse background. Because the primary focus of this study is M87, we selected a background region in close proximity to M87. This approach means that the diffuse background component surrounding M87 is probably not underestimated, thereby facilitating preciser background subtraction and strengthening the overall robustness of the analysis. We combined multiple observations, subtracted the diffuse background, and normalized the image by the maximum exposure time to produce a calibrated X-ray image. We used wavedetect8 with scales = “4 8 16 32” and the default sigthresh to detect and remove point sources. The voids were filled using dmfilth8 with the POISSON method and a random seed of zero to ensure reproducibility. Adaptive smoothing was then applied using dmimgadapt with Gaussian kernels, smoothing scales from 0.1 to 10 pixels, and a minimum of 30 counts per kernel. The final X-ray image in the energy range of 0.3–2.5 keV is shown in Fig. 1.
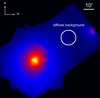 |
Fig. 1. Combined EP-FXT X-ray image of the Virgo cluster in the 0.3–2.5 keV band. The image has been vignetting corrected, background and point-source subtracted, flattened, and adaptively smoothed. The white circle marks the background region. The bar has a length of 10″. The arrows point north and west. |
Furthermore, to compare with previous results, we reanalyzed a Chandra observation (ObsID 5826) with an exposure of 126 ks and an XMM-Newton observation (ObsID 0803670601, EPIC-MOS2) with an exposure of 65 ks. The data were reprocessed using the XMM-Newton Science Analysis System (SAS9), and time intervals affected by flares were removed through high-energy light-curve screening. In the subsequent XMM-Newton analysis, blank-sky background files were employed to improve the accuracy of the background estimation and spectral analysis.
3. Imaging analysis
To better reveal structures in the image, we applied multiple image enhancement techniques to enhance the visibility of both sharp and diffuse edges, thereby highlighting structural details more effectively across different spatial scales.
Gradient filtering enhances the visibility of both sharp and flat image features, thereby facilitating their detection and analysis (Sanders et al. 2016a,b, 2022). Because of the high noise in X-ray image gradient measurements within low-brightness regions, the adaptive Gaussian gradient magnitude (GGM) filtering was employed to select the dynamic scale. This method dynamically adjusts filter parameters based on local gradients, enabling better capture of image textures and edges (Sanders et al. 2022). Additionally, adjusting the signal-to-noise ratio (S/N) helps smooth the image, enhances the S/N, and reveals finer details. Using these techniques, we applied the adaptive GGM filter to the vignetting-corrected and background-subtracted image in the 0.3–2.5 keV energy range (see Fig. 2).
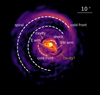 |
Fig. 2. Adaptive GGM filtered image in the central Virgo cluster in 0.3–2.5 keV with S/N = 70. Prominent features are labeled. The two dashed lines that mark the giant spiral are identical to those in Fig. 4. |
The image clearly shows two X-ray arms. The southwestern arm exhibits a clockwise rotation toward the southeast (Forman et al. 2007). This rotational feature may be attributed to the interaction between relativistic jets from the AGN and the ICM (Forman et al. 2005). Furthermore, the image also identifies a cavity, a shock to the northwest, and cold fronts to the southeast and northwest. These features are consistent with the analysis by Sanders et al. (2016b) based on Chandra data. We also identified a region in which the surface brightness was significantly reduced outward of the southwestern X-ray arm, which may indicate a cavity. The outskirts of M87 exhibit a prominent spiral morphology that extends from the northwest to the southeast, and similar spiral features are also visible in the XMM-Newton mosaic image (Roediger et al. 2011; Simionescu et al. 2010). We then generated a residual image to better visualize this large-scale faint feature.
First, we estimated the first-order radial profile using the well-known double β model and subtracted it (see Fig. 3). Except for the central region that is affected by the AGN, the EP-FXT data agree with the double β model and are consistent with the radial profiles measured by the three telescopes. Furthermore, the EP-FXT’s large FoV means that its observational range extends to regions up to 30′ from the outskirts of M87.
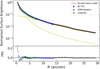 |
Fig. 3. Normalized surface brightness profiles measured with EP-FXT, XMM-Newton, and Chandra. The EP-FXT data were fit with a double β model. Individual components are displayed as dashed yellow curves. |
To characterize the radial profile, we used Sherpa (version 4.16.0 within CIAO)10 to model the surface brightness. To account for the apparently elongated morphology in the image, we fit an elliptical β model to the data; the best–fit parameters are listed in Table 2. We then subtracted this model from the original image to obtain the residual image shown in Fig. 4.
Best–fit parameters of the elliptical β model from Sherpa.
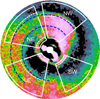 |
Fig. 4. Residual image obtained by subtracting the image in Fig. 1 with the elliptical β model. A Gaussian smoothing with a kernel size of 7 pix was applied (1 pixel = 9.6″). Four regions of interest (NW, SE, SW and NE) are marked. The dashed white lines mark the position of the radial discontinuity. The dashed blue lines mark the position of the giant spiral arm. |
The residual image revealed a few patterns, including X-ray arms and discontinuities, which indicate cold fronts or shocks. Notably, we identified a ring-like structure outside the X-ray arms that displays a break in the southern part. This may be attributed to interactions between the AGN jets and the ICM (Forman et al. 2005). Most importantly, a large-scale spiral structure with an excessive brightness is evident in the outskirts, where it spirals from the cold front in the northwest to the southern cold gas clump (marked with dashed blue lines in Fig. 4 and dashed white lines in Fig. 2). Consistent with the mosaic XMM-Newton results (Simionescu et al. 2010), the EP-FXT observations clearly reveal that the spiral features are continuous and well defined across the entire FoV, likely owing to the low particle background and wide spatial coverage of the instrument.
The outer northwestern edge (a cold front) of the spiral lies approximately 18.3′ away from the center. The structure rotates counterclockwise toward the south, and its inner southern edge is located approximately 17.5′ away from the center.
4. Imaging spectral analysis
The X-ray image obtained with EP-FXT was divided into 142 regions using the contour-binning software (Sanders 2006) with a S/N of 300. We adopted a flat-weighting assumption, assuming that the X-ray emission within each region is spatially uniform, to calculate the ancillary response files (ARFs). The ARFs were generated using the EP-FXT response tool fxtarfgen. During the calculation, the parameter extend was set to one to account for the extended nature of the source, thus more accurately capturing the spatial distribution of the emission within each extraction region. The spectra were grouped using grppha with a minimum of ten counts per bin to ensure the applicability of the C-statistic. To minimize the impact of background contamination on the source spectra and improve the accuracy of the spectral analysis, we selected observations of the M87 source and its corresponding background, ensuring similar observation times, the same filter settings, and longer exposure durations; specifically, ObsID 13600005124 and ObsID 13600005125. In the spectral analysis, both the particle background and the diffuse background were taken into account. We calculated the particle background for both observations, with a ratio of 1.05 ± 0.03, indicating that the particle background levels are nearly identical. Therefore, we selected the spectra from the same CCD region in ObsID 13600005125 to serve as the background for ObsID 13600005124. For regions in ObsID 13600005125 that were contaminated by bright point sources or extended sources, background data from nearby uncontaminated areas were used instead. Because our analysis focuses on M87, we intentionally retained the Virgo cluster component in the background data because it reflects the diffuse emission environment surrounding the galaxy better.
We spectrally fit the combined FXT-A and FXT-B spectra in each region using XSPEC version 12.14.1 over the 0.5–7.0 keV energy range. The diffuse ICM thermal emission was described with the APEC model (version 3.0.9), and the Galactic hydrogen absorption was accounted for using the TBABS model, adopting the solar abundance table from Anders & Grevesse (1989), with the redshift fixed at 0.0042 and the hydrogen column density fixed at 2.11 × 1020 cm−2 (Willingale et al. 2013). Other parameters were set to be free. We examined the C-Stat/d.o.f. values for all regions, which were consistently around 1.2. We plot the spectrum of one region in Fig. 5. The region belongs to the contour-binning partition and is located in a region approximately 6.6′ away from the cluster center. The red and black points represent the spectral data from FXT–A and FXT–B in the source region (with the diffuse background subtracted), while the solid line denotes the best-fit model. The C-Stat/d.o.f. for FXT-A and FXT-B are 246.74/287 and 295.70/299, respectively. The green and blue points display the spectral data from FXT–A and FXT–B in the diffuse background region, which is co-located on the CCD with the source region. In addition, the light cyan and orange indicate the particle backgrounds for the source and diffuse background regions, respectively.
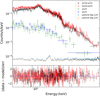 |
Fig. 5. EP-FXT spectrum from a contour-binning region in M87. The black and red points represent the spectral data from FXT-A and FXT-B for ObsID 13600005124, with the corresponding background from ObsID 13600005125 subtracted, and the solid line represents the best-fit model. The green and blue points represent the spectra from FXT-A and FXT-B for ObsID 13600005125, respectively. The light cyan and orange points represent the particle backgrounds for ObsIDs 13600005124 and 13600005125, respectively. |
4.1. The map of physical properties
The temperature map (see Fig. 6) reveals a central region in M87 with temperatures below 2.5 keV, along with two distinct low-temperature regions in the northwest and southeast. Sharp temperature increases are seen outside these regions that are coincident with the locations of two concentric arc-shaped cold fronts. A low-temperature belt extends outward from the central region. It connects the low-temperature regions in the southeast and northwest and spirals in counterclockwise from the northwest, forming a large-scale low-temperature spiral structure. In addition, a region with a lower temperature than the surrounding areas is located outside of the southwest arm. A detailed analysis is presented in Sect. 4.2.
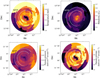 |
Fig. 6. Temperature, pressure, entropy, and metallicty maps measured with EP-FXT, pixeled with the contour-binning method. The dashed white curves mark the spiral structure as in Fig. 4. |
The metallicity was obtained from the APEC model. The metallicity is lower within the two X-ray arms, but higher north and south of the center, which is consistent with the findings by Simionescu et al. (2007), Gatuzz et al. (2022). Additionally, beyond 12′, the metallicity in the northwest is significantly higher than that in the southeast, likely due to the accumulation of cold gas in the northwest. In addition, the metallicity of the spiral structure displays higher values, which further supports the existence of the spiral structure.
To investigate its thermodynamic properties, we examined the distributions of pseudo-pressure and pseudo-entropy. The thermal pressure and entropy can be defined (Sasaki et al. 2016) as  and
and  , respectively, where ne is the electron density, and kT is the temperature. Based on the emission measure obtained from spectral fits, we obtained the pseudo-entropy and pseudo-pressure. We convert P and S into P ∝ kTnorm0.5 and S ∝ kTnorm−1/3, respectively (Fabian et al. 2006). Pseudo-pressure and pseudo-entropy maps are also displayed in Fig. 6. In the central region of M87, the pressure map reveals decreasing pressure along the eastern and southwestern X-ray arms and increasing pressure in the northwest and southeast. The entropy map shows low-entropy features coincident with both X-ray arms, exhibiting an entropy asymmetry northwest and southeast near the core. These results are consistent with those reported by Simionescu et al. (2007). The outer spiral structure also displays lower entropy values, which further supports the existence of the spiral structure.
To summarize, the EP-FXT observations revealed the spiral structure with high completeness and clarity. Moreover, we systematically mapped its thermodynamic properties, including temperature, metal abundance, and entropy, through two-dimensional distributions. These results provide detailed and spatially resolved evidence for the existence and evolution of the spiral structure.
4.2. Radial sector profiles
In the residual map (see Fig. 4), we defined four sector regions of interest (NW, SE, NE, and SW). Using Fig. 1, we extracted the radial profiles of the surface brightness and temperature in each region (see Fig. 7). The surface brightness profiles near the cold fronts were fit with a broken power law. The best-fit parameters of the broken power-law model are listed in Table 3.
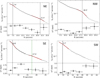 |
Fig. 7. Radial profiles of surface brightness and temperature in the four sectorial regions marked NE, NW, SE, and SW. The surface brightness was extracted from Fig. 1. The red curves indicate the best-fit broken power-law model. The temperature increases and decreases at density discontinuities are marked by vertical black and green lines, respectively. |
Parameters of the best-fit broken power-law model.
In the northeast, two surface brightness drops are detected at R = 7.44 ± 0.04′ and R = 21.40 ± 0.14′. At R = 21.40 ± 0.14′, a modest increase in the temperature is found from  to
to  at the 1.7σ level (the uncertainties are quoted at the 1σ level). While the temperature change alone is not highly significant, the corresponding surface brightness discontinuity and the location in the outskirts of M87 (where the S/N is lower) suggest that this feature likely marks the outer boundary of the northeastern spiral structure.
In the northwest, a drop in the surface brightness is found at R = 18.33 ± 0.08′, accompanied by a rise in temperature from  to
to  , corresponding to a significance of approximately 2.2σ. Despite the moderate significance of the temperature jump, the surface brightness edge, coupled with the low S/N in the outskirts, supports the classification of this feature as a cold front. This agrees with previous findings.
In the southeast, a cold front is identified at R = 6.76 ± 0.03′, indicated by a drop in the surface brightness and a temperature increase from  to
to  at the 3.3σ level. At R = 17.52 ± 0.22′, the surface brightness shows a mild discontinuity, transitioning from a deficit to an excess in the residual map (see Fig. 4). This feature may correspond to the inner boundary of the southeastern portion of the spiral structure.
A region of excess surface brightness is detected in the southwest at R = 9.75 ± 0.07′, which might be associated with an arc-shaped feature from past AGN activity (Forman et al. 2005). The surface brightness discontinuity is described by a broken power-law model, and a corresponding radial temperature increase further supports the possible presence of a weak cold front.
We compared the radial temperature profile derived from EP-FXT observations with the results reported by Gatuzz et al. (2022) based on XMM-Newton data. The two profiles show a broadly consistent trend, with comparable shapes and temperatures ranging from approximately 2 to 3 keV.
5. Discussion
The imaging and imaging-spectral analyses revealed detailed structures at the center of the Virgo cluster. In addition to the well-known X-ray arms, cavities, and cold fronts, a large-scale sloshing spiral pattern is identified in the GGM and residual images, where it connects the two previously recognized cold fronts. The low particle background and wide FoV allow the EP-FXT observations to provide a continuous view of the spiral structure in the outskirts of M87. This is consistent with a similar pattern seen in the mosaic image from XMM-Newton (Simionescu et al. 2010). Building on these observations, we employed EP-FXT data to construct two-dimensional thermodynamic maps of the outskirts of M87 to provide further insight into the large-scale physical properties of the spiral structure. In this section, we discuss the properties of the spiral structure and compare the results with those obtained by XMM-Newton.
5.1. Comparison with XMM-Newton
Using the same contour-binning regions as defined for the EP-FXT data, we performed spectral fitting on the archival XMM-Newton observation (ObsID 0803670601) over the 0.5–7.0 keV energy band, adopting the same model described in Sect. 4. The temperatures for each region were compared with those obtained from EP-FXT, as shown in Fig. 8 and Table 4. In each panel, the blue dashed line denotes the one-to-one correspondence, while the red solid line represents the best-fit linear regression.
Comparison of the temperatures measured by EP-FXT and XMM-Newton.
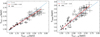 |
Fig. 8. Comparison of the temperature in each pixel between EP-FXT and XMM-Newton. The dashed blue line represents the 1:1 ratio. The red line represents the best-fit linear regression, shown in the legend. |
As shown in Fig. 8, the temperatures measured by FXT-A and FXT-B are consistent within the uncertainties, although the temperature from FXT-A appears to be slightly higher than that from FXT-B. This discrepancy may be attributed to the greater effective area of FXT-B at lower energies. Overall, the temperatures obtained from EP-FXT generally agree with those derived from XMM-Newton, despite minor discrepancies. These differences may result from the multitemperature components within the ICM and from calibration differences of the two telescopes, which together can lead to systematic discrepancies in the temperature measurements (Migkas et al. 2024; Liu et al. 2023; Schellenberger et al. 2015). Overall, EP-FXT delivers results that are consistent with and comparable to those of XMM-Newton.
5.2. Giant sloshing spiral
Based on the above analysis, we further confirmed the previously identified spiral structure using the GGM and residual images from EP-FXT, which provide a comprehensive view of the feature. Subsequently, we performed an imaging-spectrum analysis to construct two-dimensional maps of the temperature, metallicity, and entropy in the outskirts of M87, providing a spatially resolved characterization of the thermodynamic properties of the spiral structure. The results show that throughout the spiral, the metallicity is enhanced, while temperature and entropy are reduced. In addition, the spiral structure exhibits significant surface brightness enhancements. Cooler gas is preferentially concentrated in the brighter regions, where it forms an alternating pattern of bright cold areas and dimmer hotter regions. Numerical simulations by Roediger et al. (2011) predicted that these structures should exhibit low temperatures, high densities, and an elevated metallicity. Our observations are consistent with these predictions and support the scenario in which the large-scale spiral structure is produced by gas sloshing that was triggered by a minor merger event (Ascasibar & Markevitch 2006).
Figure 9 shows the large spiral structure in Virgo as detected by EP-FXT. It consists of an inner ring-like structure and outer spiral arms. Northeast of the spiral structure (as indicated by the white arrow), the X-ray surface brightness is lower than in the surrounding regions and forms a concave feature. Two additional X-ray concave regions are also present in the west-southwest. This structure is similar to the Kelvin-Helmholtz rolls presented in the simulations and the smeared-out spiral structures observed in A496 (Walker et al. 2017; Ghizzardi et al. 2014). This similarity may be attributed to the influence of the Kelvin-Helmholtz instability, which generates turbulence and disturbances near the cold front that might affect the formation of the spiral structure.
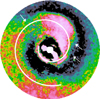 |
Fig. 9. EP-FXT surface brightness residual image in the 0.3–2.5 keV band showing a spiral structure. The white arrowheads indicate locations where this structure is truncated, possibly because of the Kelvin-Helmholtz instability. The central ring structure of M87 and the outer spiral structure appear to be part of a single larger structure, as delineated by the white spiral line. |
Overall, EP-FXT provides a clear and comprehensive view of the large-scale spiral pattern in M87. The spiral feature appears to rotate counterclockwise and extends from the cold front in the southeast to the cold front in the northwest. It further spirals toward the cold gas clump in the southern outskirts. This spiral feature is associated with a low temperature, low entropy, and high metallicity, consistent with expectations for gas-sloshing phenomena. The prominent and well-defined morphology revealed by EP-FXT offers valuable insights into the formation and evolution of spiral structures in galaxy clusters.
6. Conclusion
We provided a detailed analysis of the images and spectra of the Virgo cluster with EP-FXT. The images show a prominent and complete large-scale spiral structure. Furthermore, we produced two-dimensional maps of the temperature, entropy, and metallicity that clearly illustrated the characteristics of the M87 spiral structure. The main results of this work are summarized below.
-
In the GGM image, multiple structures are identified. Two prominent X-ray arms are clearly visible: The outer side of the southwest arm bends toward the southeast, and the east arm bends toward the northwest. A shock from the northwest appears to be connected to the east arm. Furthermore, cold fronts in the southeast and northwest are also readily discernible. These structures are broadly consistent with previous findings.
-
Based on the residual map (see Fig. 4), a ring-like structure with an enhanced surface brightness is found in the outer X-ray arms. This ring-like structure is connected to the northwestern cold front and rotates counterclockwise. It forms a large, outward-extending spiral structure. This structure has a low temperature, low entropy, and high density. These characteristics are consistent with gas sloshing induced by the merger of a gasless subcluster.
-
The temperatures measured with EP-FXT are consistent with those obtained with XMM-Newton within the errors.
The X-ray Multi-Mirror Mission.
Chandra X-ray Observatory.
ROentgen SATellite.
Originally named Astro-E2.
The extended Roentgen Survey and Imaging Telescope Array.
Derived from the Chandra Interactive Analysis of Observations (CIAO) version 4.16.0, available at https://cxc.cfa.harvard.edu/ciao/
Acknowledgments
EP is a space mission supported by Strategic Priority Program on Space Science of Chinese Academy of Sciences, in collaboration with ESA, MPE and CNES (Grant No. XDA15310303, No. XDA15310103, No. XDA15052100). This work is supported by the International Partnership Program of Chinese Academy of Sciences, Grant No. 013GJHZ2024015FN. CJ acknowledges the National Natural Science Foundation of China through grant 12473016, and the support by the Strategic Priority Research Program of the Chinese Academy of Sciences (Grant No. XDB0550200). A.L. acknowledges the supports from the National Natural Science Foundation of China (Grant No. 12588202). A.L. is supported by the China Manned Space Program with grant no. CMS-CSST-2025-A04.
References
- Anders, E., & Grevesse, N. 1989, Geochim. Cosmochim. Acta, 53, 197 [Google Scholar]
- Ascasibar, Y., & Markevitch, M. 2006, ApJ, 650, 102 [Google Scholar]
- Bahcall, J. N., & Sarazin, C. L. 1977, ApJ, 213, L99 [NASA ADS] [CrossRef] [Google Scholar]
- Blanton, E. L., Randall, S. W., Clarke, T. E., et al. 2011, ApJ, 737, 99 [Google Scholar]
- Bohringer, H., Nulsen, P. E. J., Braun, R., & Fabian, A. C. 1995, MNRAS, 274, L67 [CrossRef] [Google Scholar]
- Böhringer, H., Belsole, E., Kennea, J., et al. 2001, A&A, 365, L181 [NASA ADS] [CrossRef] [EDP Sciences] [Google Scholar]
- Botteon, A., Giacintucci, S., Gastaldello, F., et al. 2021, A&A, 649, A37 [NASA ADS] [CrossRef] [EDP Sciences] [Google Scholar]
- Botteon, A., Gastaldello, F., ZuHone, J. A., et al. 2024, MNRAS, 527, 919 [Google Scholar]
- Cui, W., Wang, H., Zhao, X., et al. 2023, Exp. Astron., 55, 603 [Google Scholar]
- de Plaa, J., Werner, N., Simionescu, A., et al. 2010, A&A, 523, A81 [NASA ADS] [CrossRef] [EDP Sciences] [Google Scholar]
- Ettori, S., Gastaldello, F., Gitti, M., et al. 2013, A&A, 555, A93 [NASA ADS] [CrossRef] [EDP Sciences] [Google Scholar]
- Fabian, A. C., Sanders, J. S., Taylor, G. B., et al. 2006, MNRAS, 366, 417 [NASA ADS] [CrossRef] [Google Scholar]
- Forman, W., Nulsen, P., Heinz, S., et al. 2005, ApJ, 635, 894 [NASA ADS] [CrossRef] [Google Scholar]
- Forman, W., Jones, C., Churazov, E., et al. 2007, ApJ, 665, 1057 [NASA ADS] [CrossRef] [Google Scholar]
- Gatuzz, E., Sanders, J. S., Dennerl, K., et al. 2022, MNRAS, 511, 4511 [NASA ADS] [CrossRef] [Google Scholar]
- Ghizzardi, S., Rossetti, M., & Molendi, S. 2010, A&A, 516, A32 [NASA ADS] [CrossRef] [EDP Sciences] [Google Scholar]
- Ghizzardi, S., De Grandi, S., & Molendi, S. 2014, A&A, 570, A117 [NASA ADS] [CrossRef] [EDP Sciences] [Google Scholar]
- Harms, R. J., Ford, H. C., Tsvetanov, Z. I., et al. 1994, ApJ, 435, L35 [CrossRef] [Google Scholar]
- Inoue, H. 2022, PASJ, 74, 152 [NASA ADS] [CrossRef] [Google Scholar]
- Kadam, S. K., Salunkhe, S., Vagshette, N. D., et al. 2024a, MNRAS, 531, 4060 [Google Scholar]
- Kadam, S. K., Sonkamble, S. S., Vagshette, N. D., & Patil, M. K. 2024b, New Astron., 111, 102253 [Google Scholar]
- Keshet, U. 2012, ApJ, 753, 120 [Google Scholar]
- Kravtsov, A. V., & Borgani, S. 2012, ARA&A, 50, 353 [Google Scholar]
- Liu, A., Yu, H., Diaferio, A., et al. 2018, ApJ, 863, 102 [NASA ADS] [CrossRef] [Google Scholar]
- Liu, A., Bulbul, E., Ramos-Ceja, M. E., et al. 2023, A&A, 670, A96 [NASA ADS] [CrossRef] [EDP Sciences] [Google Scholar]
- Machacek, M. E., Jones, C., Kraft, R. P., et al. 2023, ApJ, 958, 93 [Google Scholar]
- Markevitch, M., & Vikhlinin, A. 2007, Phys. Rep., 443, 1 [Google Scholar]
- Markevitch, M., Vikhlinin, A., & Mazzotta, P. 2001, ApJ, 562, L153 [NASA ADS] [CrossRef] [Google Scholar]
- McCall, H., Reiprich, T. H., Veronica, A., et al. 2024, A&A, 689, A113 [NASA ADS] [CrossRef] [EDP Sciences] [Google Scholar]
- Migkas, K., Kox, D., Schellenberger, G., et al. 2024, A&A, 688, A107 [NASA ADS] [CrossRef] [EDP Sciences] [Google Scholar]
- Molendi, S., & Gastaldello, F. 2001, A&A, 375, L14 [NASA ADS] [CrossRef] [EDP Sciences] [Google Scholar]
- Owers, M. S., Nulsen, P. E. J., Couch, W. J., & Markevitch, M. 2009, ApJ, 704, 1349 [Google Scholar]
- Paterno-Mahler, R., Blanton, E. L., Randall, S. W., & Clarke, T. E. 2013, ApJ, 773, 114 [NASA ADS] [CrossRef] [Google Scholar]
- Roediger, E., Brüggen, M., Simionescu, A., et al. 2011, MNRAS, 413, 2057 [Google Scholar]
- Roediger, E., Lovisari, L., Dupke, R., et al. 2012, MNRAS, 420, 3632 [CrossRef] [Google Scholar]
- Rossetti, M. C. 2013, in Cold fronts in Galaxy Clusters: Sloshing through the Dolomites, 15 [Google Scholar]
- Sanders, J. S. 2006, MNRAS, 371, 829 [Google Scholar]
- Sanders, J. S., Fabian, A. C., Taylor, G. B., et al. 2016a, MNRAS, 457, 82 [Google Scholar]
- Sanders, J. S., Fabian, A. C., Russell, H. R., Walker, S. A., & Blundell, K. M. 2016b, MNRAS, 460, 1898 [Google Scholar]
- Sanders, J. S., Biffi, V., Brüggen, M., et al. 2022, A&A, 661, A36 [NASA ADS] [CrossRef] [EDP Sciences] [Google Scholar]
- Sasaki, T., Matsushita, K., Sato, K., & Okabe, N. 2016, PASJ, 68, 85 [Google Scholar]
- Schellenberger, G., Reiprich, T. H., Lovisari, L., Nevalainen, J., & David, L. 2015, A&A, 575, A30 [NASA ADS] [CrossRef] [EDP Sciences] [Google Scholar]
- Simionescu, A., Böhringer, H., Brüggen, M., & Finoguenov, A. 2007, A&A, 465, 749 [NASA ADS] [CrossRef] [EDP Sciences] [Google Scholar]
- Simionescu, A., Werner, N., Forman, W. R., et al. 2010, MNRAS, 405, 91 [NASA ADS] [Google Scholar]
- Simionescu, A., Werner, N., Mantz, A., Allen, S. W., & Urban, O. 2017, MNRAS, 469, 1476 [Google Scholar]
- Sonkamble, S. S., Kadam, S. K., Paul, S., et al. 2024, JApA, 45, 23 [Google Scholar]
- Vikhlinin, A. A., Kravtsov, A. V., Markevich, M. L., Sunyaev, R. A., & Churazov, E. M. 2014, Phys. Uspekhi, 57, 317 [Google Scholar]
- Walker, S. A., Hlavacek-Larrondo, J., Gendron-Marsolais, M., et al. 2017, MNRAS, 468, 2506 [NASA ADS] [CrossRef] [Google Scholar]
- Willingale, R., Starling, R. L. C., Beardmore, A. P., Tanvir, N. R., & O’Brien, P. T. 2013, MNRAS, 431, 394 [Google Scholar]
- Yuan, W., Zhang, C., Chen, Y., & Ling, Z. 2022, in Handbook of X-ray and Gamma-ray Astrophysics, eds. C. Bambi, & A. Sangangelo, 86 [Google Scholar]
- Yuan, W., Dai, L., Feng, H., et al. 2025, Sci. China Phys., Mech. Astron., 68, 239501 [Google Scholar]
- Zhang, J., Qi, L., Yang, Y., et al. 2022, Astropart. Phys., 137, 102668 [Google Scholar]
- Zhao, H. S., Li, C. K., Wang, J., et al. 2025, Radiation Detection Technology and Methods [Google Scholar]
- ZuHone, J. A., Markevitch, M., & Johnson, R. E. 2010, ApJ, 717, 908 [Google Scholar]
All Tables
Best–fit parameters of the elliptical β model from Sherpa.
|
Fig. 4. Residual image obtained by subtracting the image in Fig. 1 with the elliptical β model. A Gaussian smoothing with a kernel size of 7 pix was applied (1 pixel = 9.6″). Four regions of interest (NW, SE, SW and NE) are marked. The dashed white lines mark the position of the radial discontinuity. The dashed blue lines mark the position of the giant spiral arm. |
All Figures
|
Fig. 1. Combined EP-FXT X-ray image of the Virgo cluster in the 0.3–2.5 keV band. The image has been vignetting corrected, background and point-source subtracted, flattened, and adaptively smoothed. The white circle marks the background region. The bar has a length of 10″. The arrows point north and west. |
| In the text | |
|
Fig. 2. Adaptive GGM filtered image in the central Virgo cluster in 0.3–2.5 keV with S/N = 70. Prominent features are labeled. The two dashed lines that mark the giant spiral are identical to those in Fig. 4. |
| In the text | |
|
Fig. 3. Normalized surface brightness profiles measured with EP-FXT, XMM-Newton, and Chandra. The EP-FXT data were fit with a double β model. Individual components are displayed as dashed yellow curves. |
| In the text | |
|
Fig. 4. Residual image obtained by subtracting the image in Fig. 1 with the elliptical β model. A Gaussian smoothing with a kernel size of 7 pix was applied (1 pixel = 9.6″). Four regions of interest (NW, SE, SW and NE) are marked. The dashed white lines mark the position of the radial discontinuity. The dashed blue lines mark the position of the giant spiral arm. |
| In the text | |
|
Fig. 5. EP-FXT spectrum from a contour-binning region in M87. The black and red points represent the spectral data from FXT-A and FXT-B for ObsID 13600005124, with the corresponding background from ObsID 13600005125 subtracted, and the solid line represents the best-fit model. The green and blue points represent the spectra from FXT-A and FXT-B for ObsID 13600005125, respectively. The light cyan and orange points represent the particle backgrounds for ObsIDs 13600005124 and 13600005125, respectively. |
| In the text | |
|
Fig. 6. Temperature, pressure, entropy, and metallicty maps measured with EP-FXT, pixeled with the contour-binning method. The dashed white curves mark the spiral structure as in Fig. 4. |
| In the text | |
|
Fig. 7. Radial profiles of surface brightness and temperature in the four sectorial regions marked NE, NW, SE, and SW. The surface brightness was extracted from Fig. 1. The red curves indicate the best-fit broken power-law model. The temperature increases and decreases at density discontinuities are marked by vertical black and green lines, respectively. |
| In the text | |
|
Fig. 8. Comparison of the temperature in each pixel between EP-FXT and XMM-Newton. The dashed blue line represents the 1:1 ratio. The red line represents the best-fit linear regression, shown in the legend. |
| In the text | |
|
Fig. 9. EP-FXT surface brightness residual image in the 0.3–2.5 keV band showing a spiral structure. The white arrowheads indicate locations where this structure is truncated, possibly because of the Kelvin-Helmholtz instability. The central ring structure of M87 and the outer spiral structure appear to be part of a single larger structure, as delineated by the white spiral line. |
| In the text | |
Current usage metrics show cumulative count of Article Views (full-text article views including HTML views, PDF and ePub downloads, according to the available data) and Abstracts Views on Vision4Press platform.
Data correspond to usage on the plateform after 2015. The current usage metrics is available 48-96 hours after online publication and is updated daily on week days.
Initial download of the metrics may take a while.