Open Access
Fig. 6.
Download original image
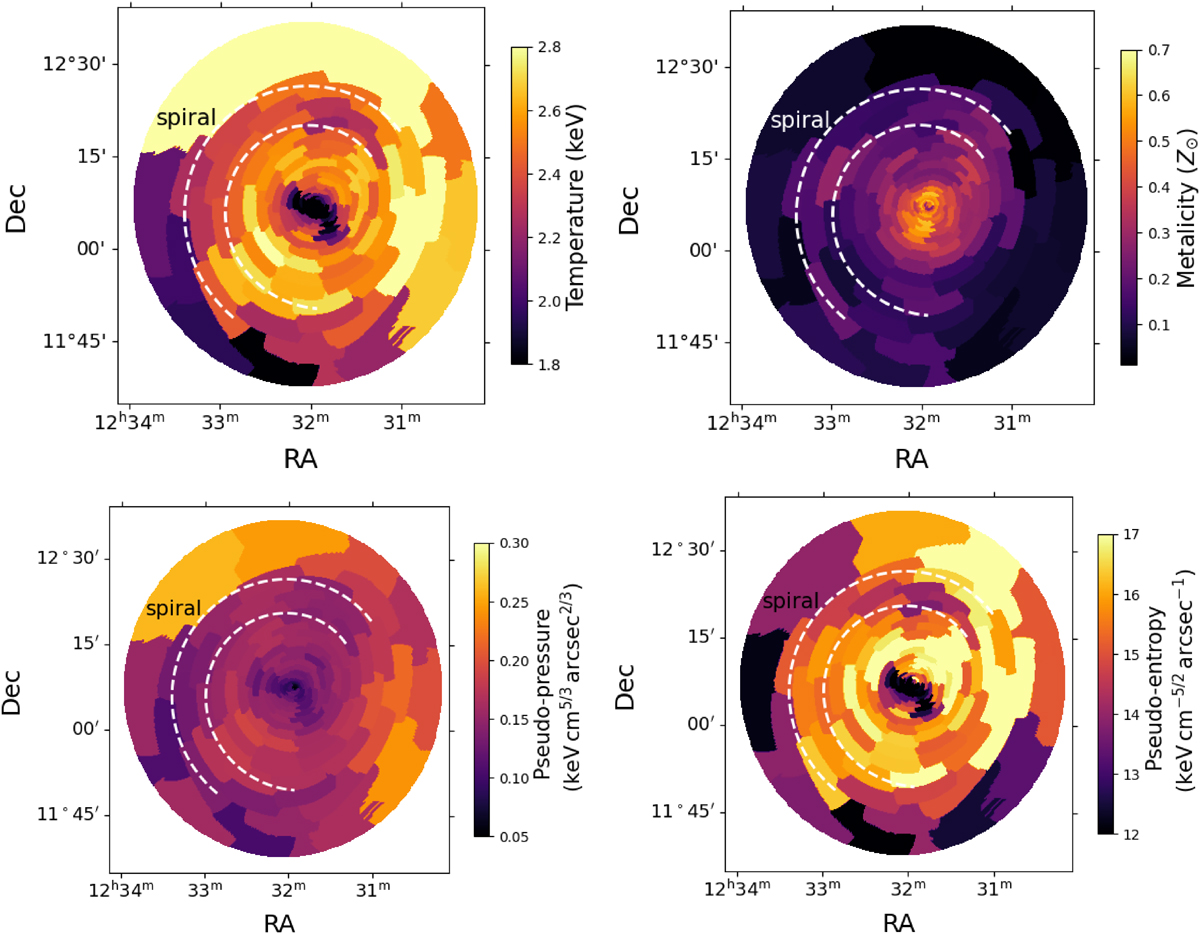
Temperature, pressure, entropy, and metallicty maps measured with EP-FXT, pixeled with the contour-binning method. The dashed white curves mark the spiral structure as in Fig. 4.
Current usage metrics show cumulative count of Article Views (full-text article views including HTML views, PDF and ePub downloads, according to the available data) and Abstracts Views on Vision4Press platform.
Data correspond to usage on the plateform after 2015. The current usage metrics is available 48-96 hours after online publication and is updated daily on week days.
Initial download of the metrics may take a while.