Fig. 7.
Download original image
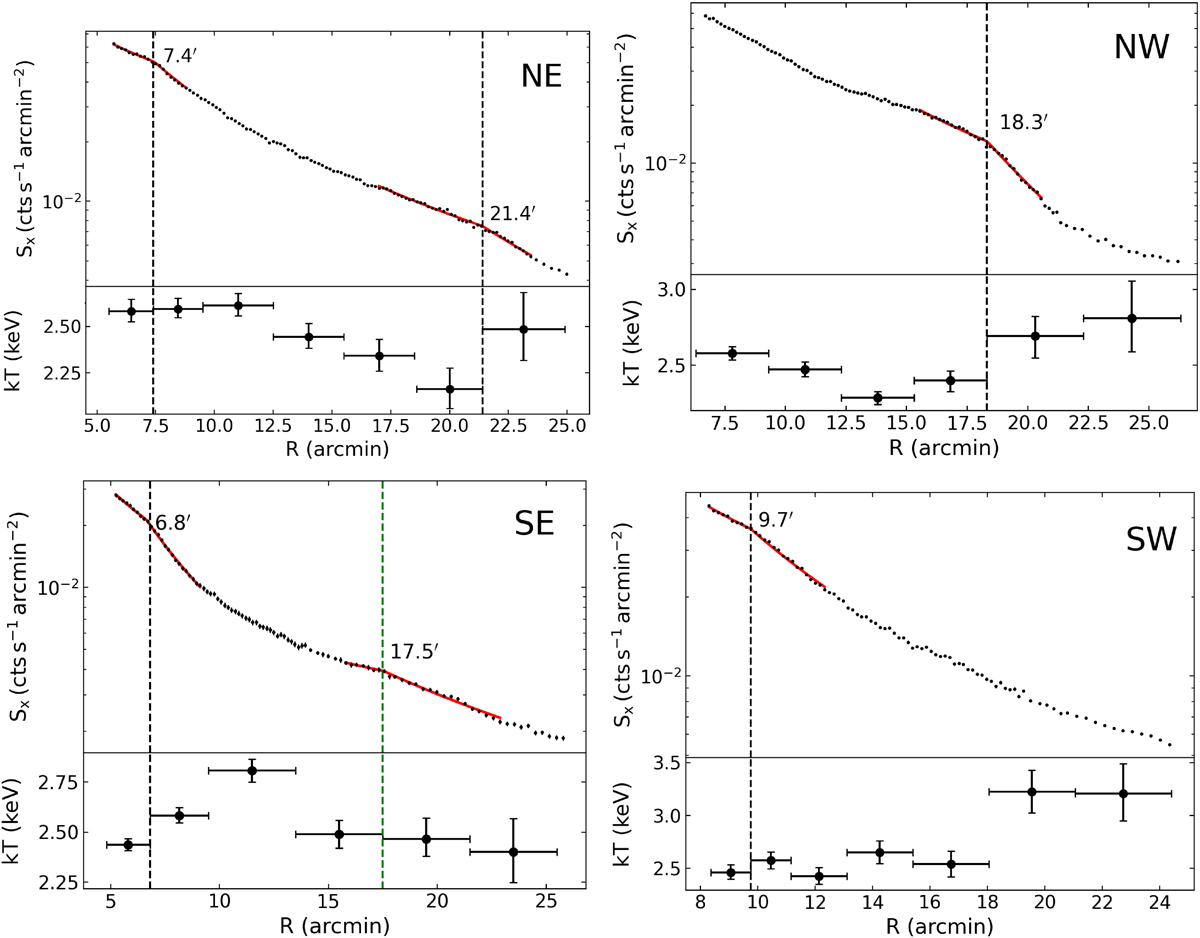
Radial profiles of surface brightness and temperature in the four sectorial regions marked NE, NW, SE, and SW. The surface brightness was extracted from Fig. 1. The red curves indicate the best-fit broken power-law model. The temperature increases and decreases at density discontinuities are marked by vertical black and green lines, respectively.
Current usage metrics show cumulative count of Article Views (full-text article views including HTML views, PDF and ePub downloads, according to the available data) and Abstracts Views on Vision4Press platform.
Data correspond to usage on the plateform after 2015. The current usage metrics is available 48-96 hours after online publication and is updated daily on week days.
Initial download of the metrics may take a while.