Fig. A.1
Download original image
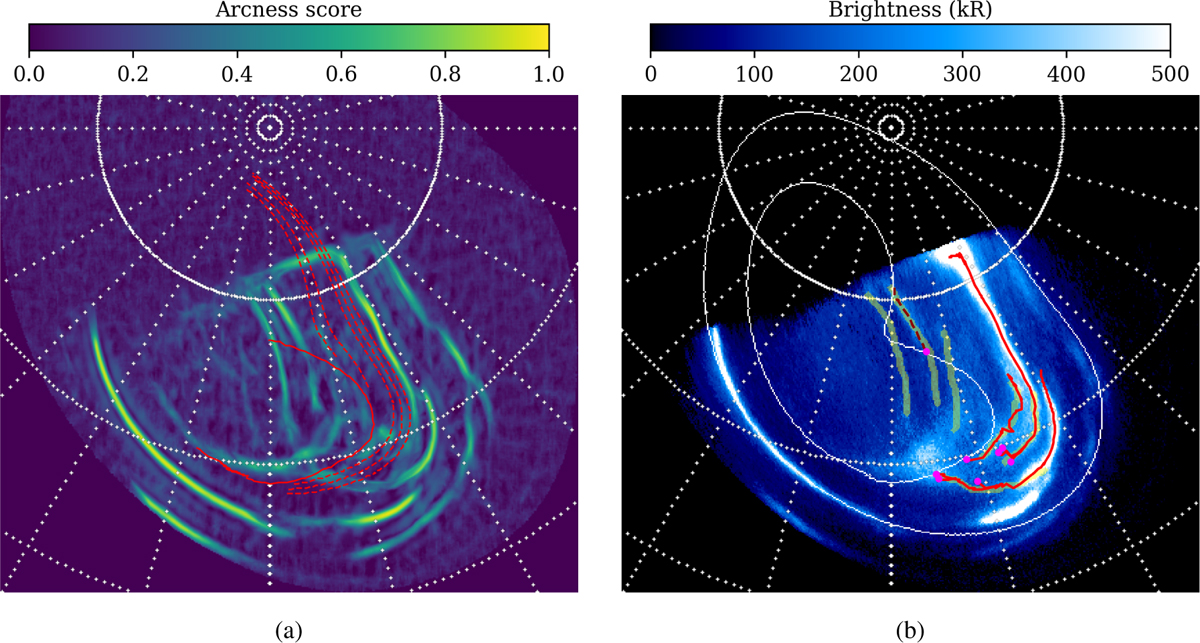
(a) Arc convolution of the auroral image shown in Figure 1. Red lines denote the mapped magnetopause (solid) and fixed-radius contours (dashed) described in the text. (b) Results of the bridge-detection algorithm after filtering. Red solid lines denote detected arcs identified as bridges. Dark-red dashed lines denote arcs identified as PAFs. The seed point of each arc is in magenta. Manually designated arcs are in green. White contours give the region of validity of the Vogt et al. (2011) JRM33 flux-equivalence mapping along closed field lines.
Current usage metrics show cumulative count of Article Views (full-text article views including HTML views, PDF and ePub downloads, according to the available data) and Abstracts Views on Vision4Press platform.
Data correspond to usage on the plateform after 2015. The current usage metrics is available 48-96 hours after online publication and is updated daily on week days.
Initial download of the metrics may take a while.