Open Access
Fig. B.2
Download original image
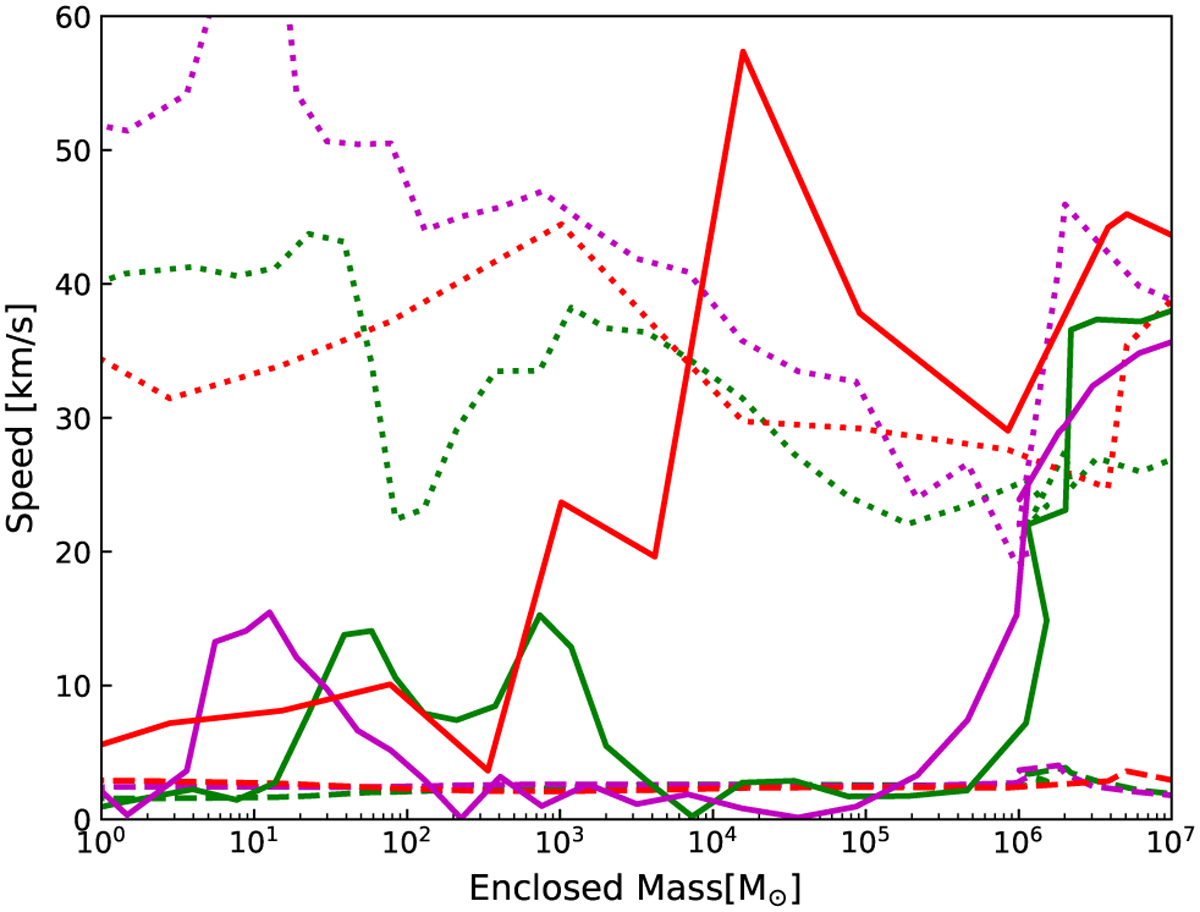
Gas velocity profiles versus the enclosed mass. Dotted lines show the turbulent velocities, solid lines the infall velocities, and dashed lines thermal sound speeds. Magenta, green, and red colors show time evolution, from earlier to later times.
Current usage metrics show cumulative count of Article Views (full-text article views including HTML views, PDF and ePub downloads, according to the available data) and Abstracts Views on Vision4Press platform.
Data correspond to usage on the plateform after 2015. The current usage metrics is available 48-96 hours after online publication and is updated daily on week days.
Initial download of the metrics may take a while.