Fig. 10.
Download original image
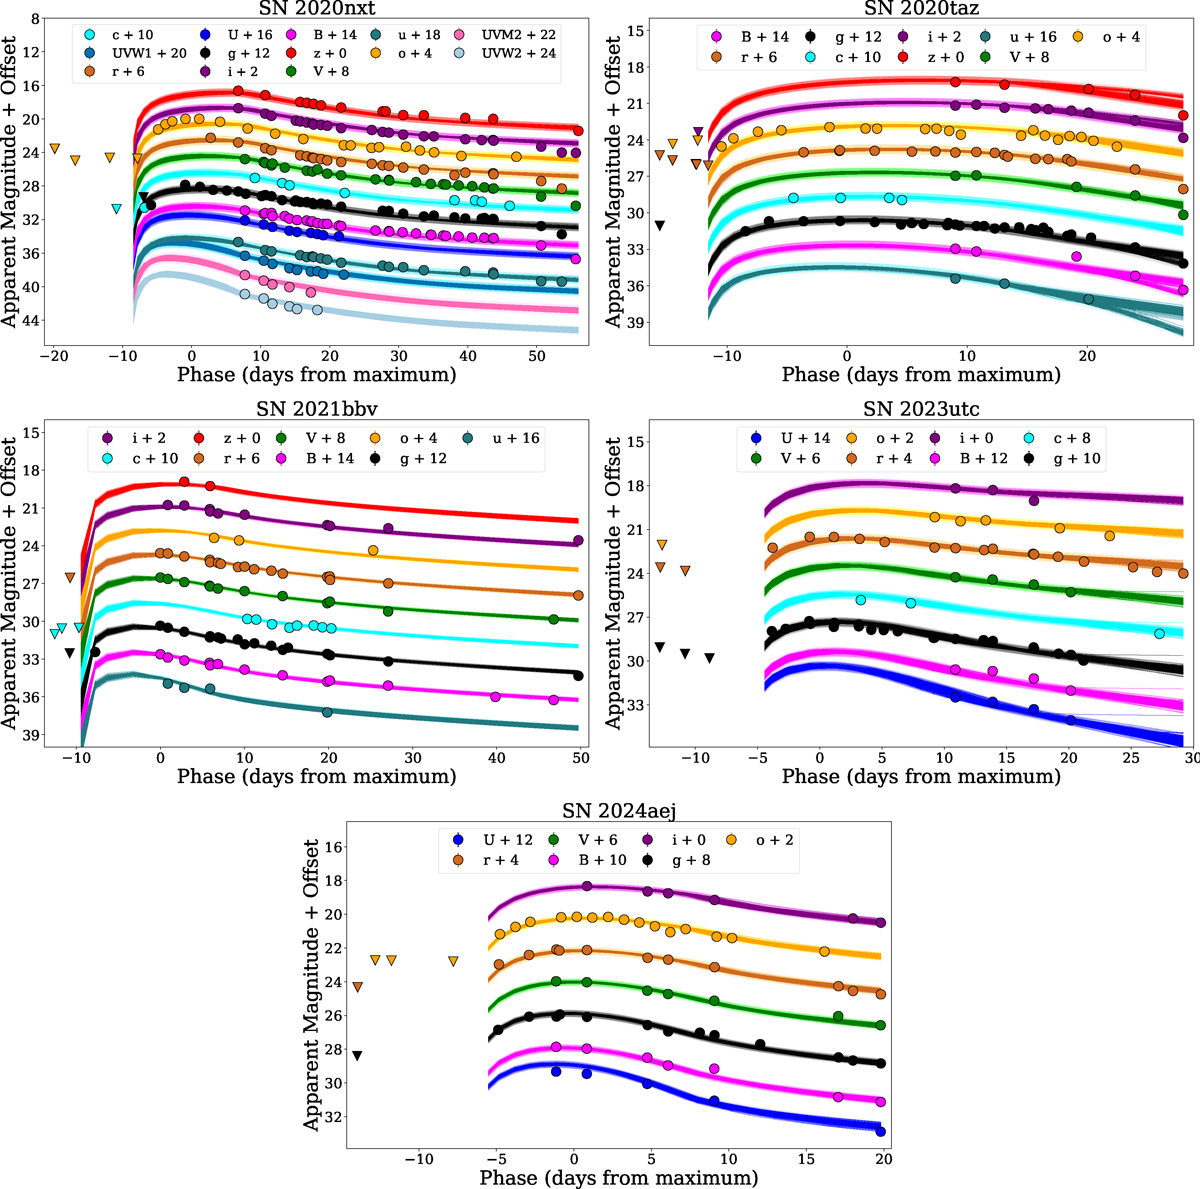
Light curves from the RD+CSI model fitted to the multi-band photometry of five SNe Ibn using the Monte Carlo code MOSFiT. For each filter, a representative subset of model light curves randomly drawn from the posterior distributions is shown to illustrate the range of the model fits. The latest pre-discovery upper limits are indicated by triangles.
Current usage metrics show cumulative count of Article Views (full-text article views including HTML views, PDF and ePub downloads, according to the available data) and Abstracts Views on Vision4Press platform.
Data correspond to usage on the plateform after 2015. The current usage metrics is available 48-96 hours after online publication and is updated daily on week days.
Initial download of the metrics may take a while.