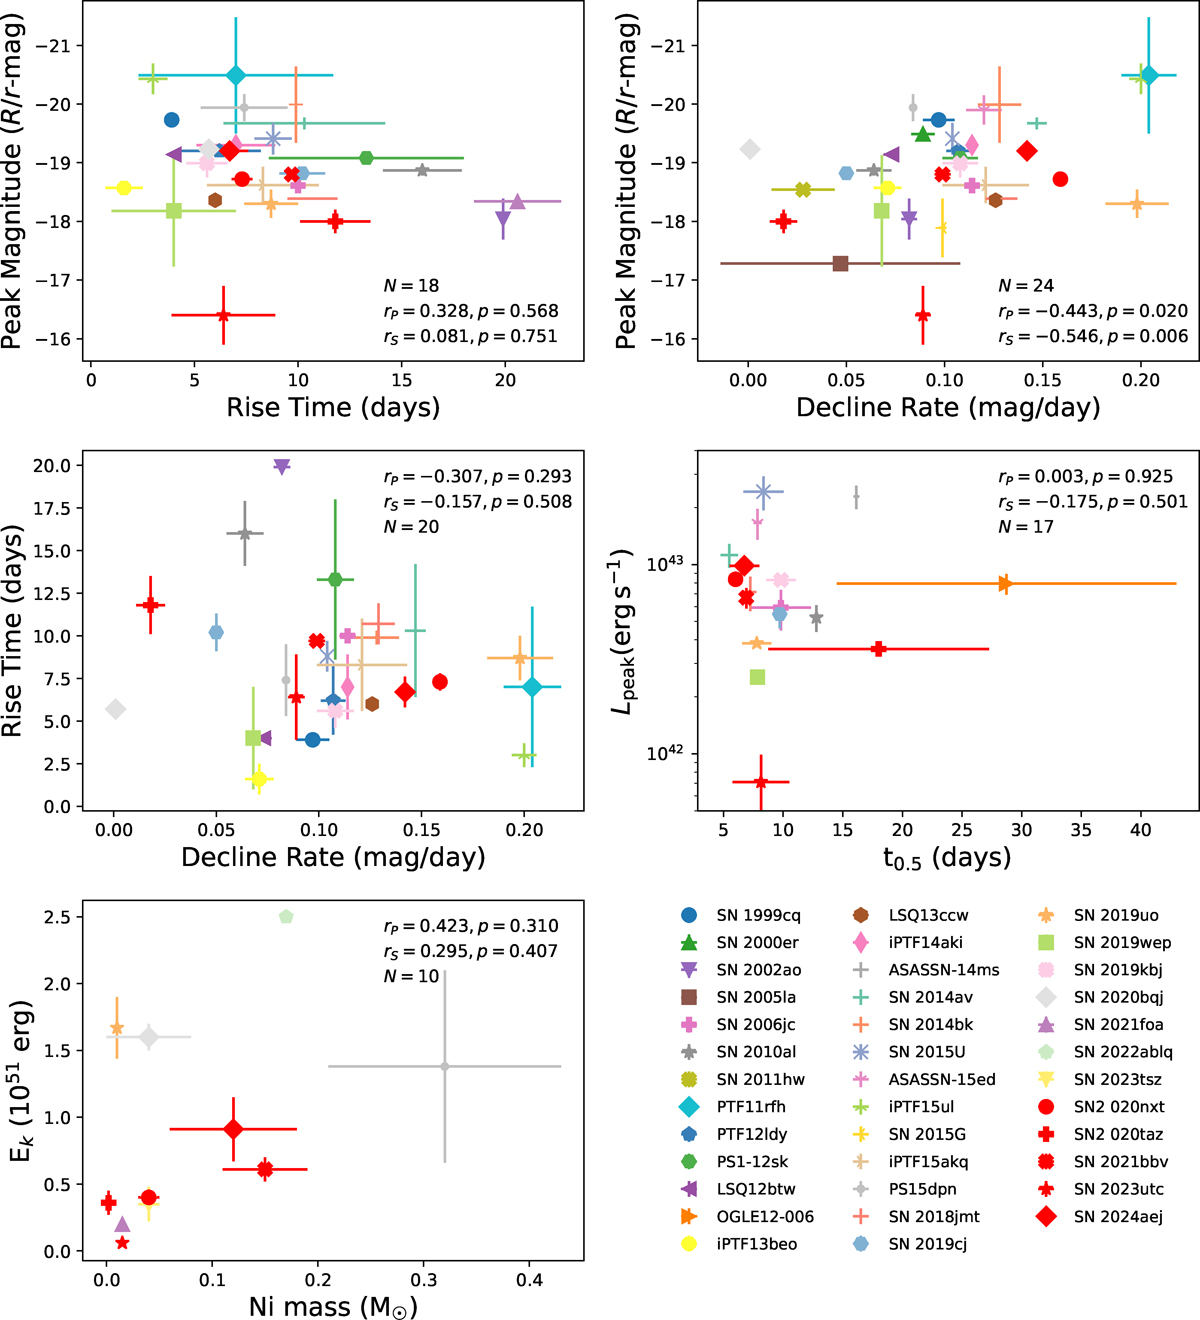
Fig. 11.
Download original image
Relationships between parameters inferred from the light curves of SNe Ibn. Top left: R/r-band peak magnitude versus rise time. Top right: R/r-band peak magnitude versus R/r-band decline rate. Centre left: Rise time versus R/r-band decline rate. Centre right: Peak luminosity (Lpeak) versus t0.5 (the time required for the luminosity to decline by half from its peak). Bottom left: Kinetic energy (EK) versus synthesised 56Ni mass. The weighted Pearson correlation coefficient (rP), the Spearman rank correlation coefficient (rS), and the associated p-values (probability of chance correlation) are provided for each parameter pair. Statistics exclude data points with rise time and peak magnitude limits.
Current usage metrics show cumulative count of Article Views (full-text article views including HTML views, PDF and ePub downloads, according to the available data) and Abstracts Views on Vision4Press platform.
Data correspond to usage on the plateform after 2015. The current usage metrics is available 48-96 hours after online publication and is updated daily on week days.
Initial download of the metrics may take a while.