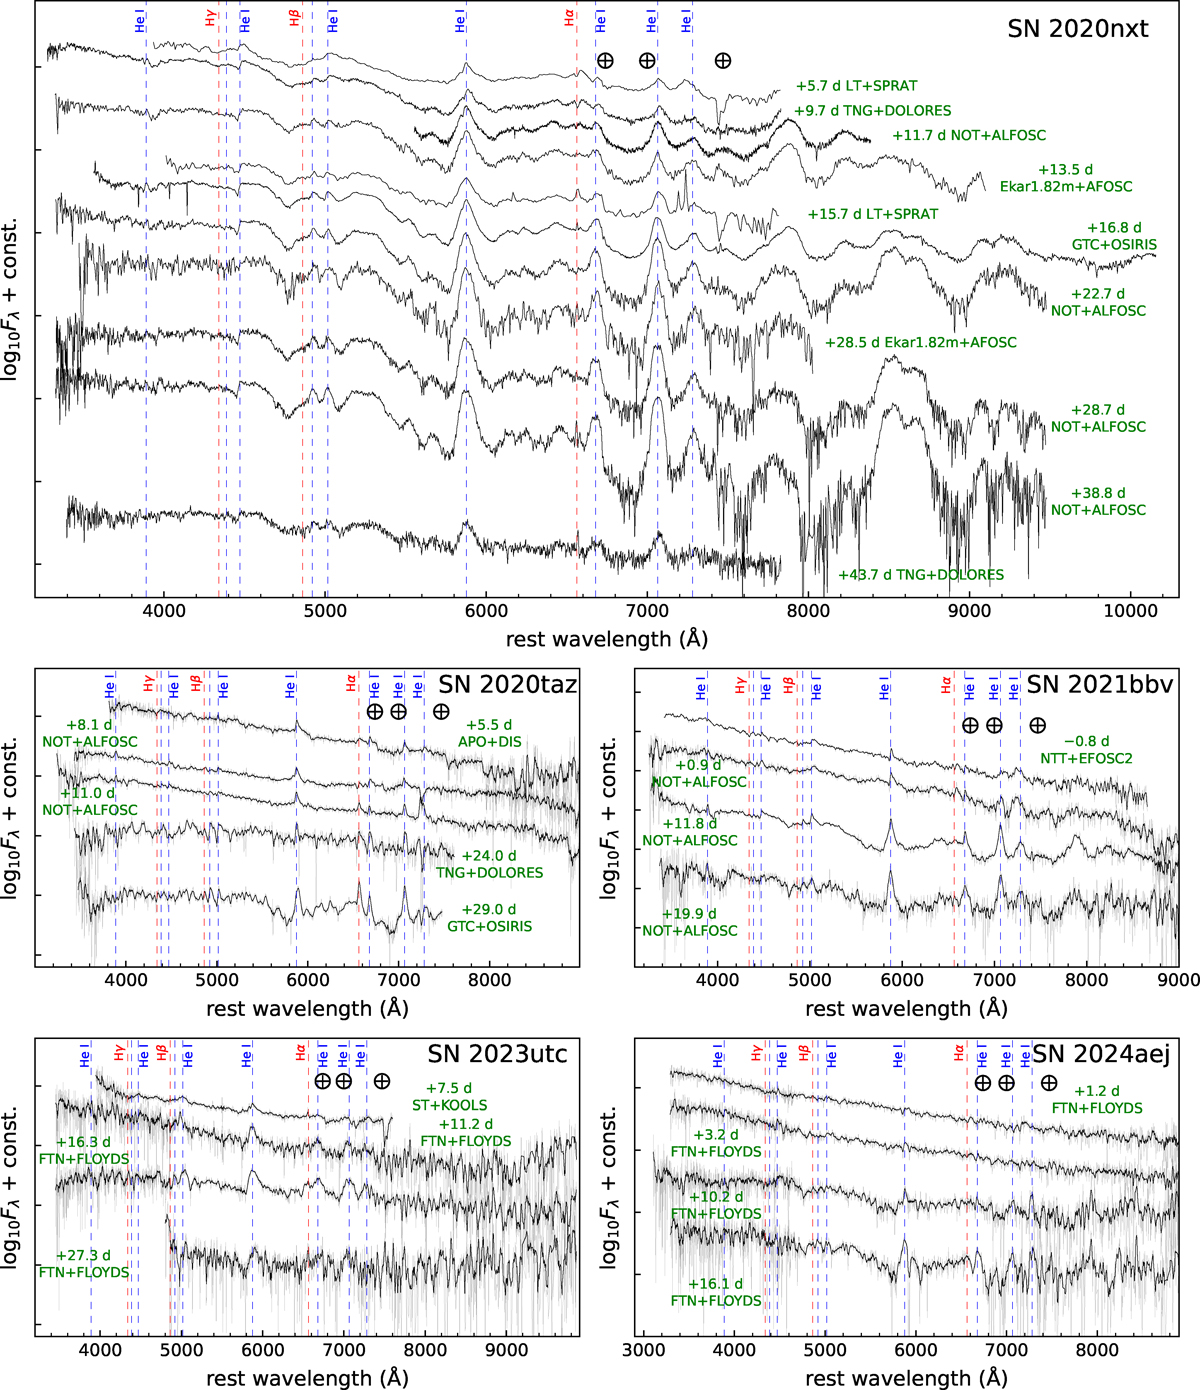
Fig. 12.
Download original image
Spectral sequences of the five SNe Ibn. The dashed vertical lines indicate the main H and He I transitions, while the ⊕ symbol marks the strongest telluric absorption bands. All spectra have been corrected for redshift and extinction. Grey lines represent smoothed spectra (originally with a lower S/N) processed with a Savitzky-Golay filter.
Current usage metrics show cumulative count of Article Views (full-text article views including HTML views, PDF and ePub downloads, according to the available data) and Abstracts Views on Vision4Press platform.
Data correspond to usage on the plateform after 2015. The current usage metrics is available 48-96 hours after online publication and is updated daily on week days.
Initial download of the metrics may take a while.