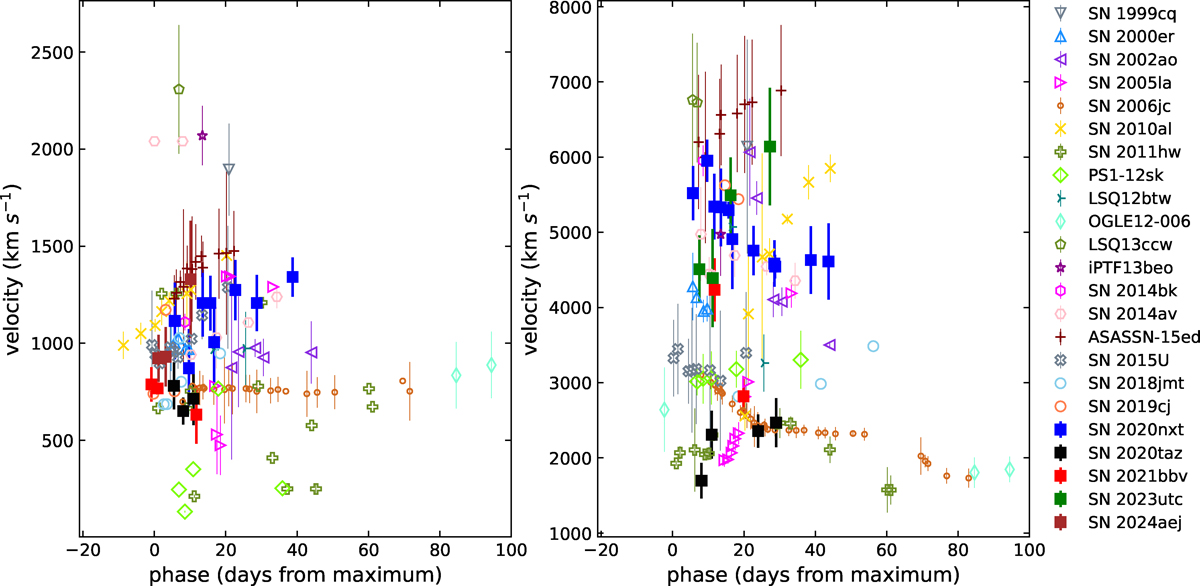
Fig. 15.
Download original image
Evolution of He I line velocities. Left panel: Temporal evolution of the velocities associated with the narrow He I line components, which trace the unshocked CSM. Right panel: Velocity evolution of the broader He I emission components, reflecting the dynamics of the shocked gas region. Data for comparison SNe Ibn are adopted from Pastorello et al. (2016) and Wang et al. (2024a).
Current usage metrics show cumulative count of Article Views (full-text article views including HTML views, PDF and ePub downloads, according to the available data) and Abstracts Views on Vision4Press platform.
Data correspond to usage on the plateform after 2015. The current usage metrics is available 48-96 hours after online publication and is updated daily on week days.
Initial download of the metrics may take a while.