Fig. G.1.
Download original image
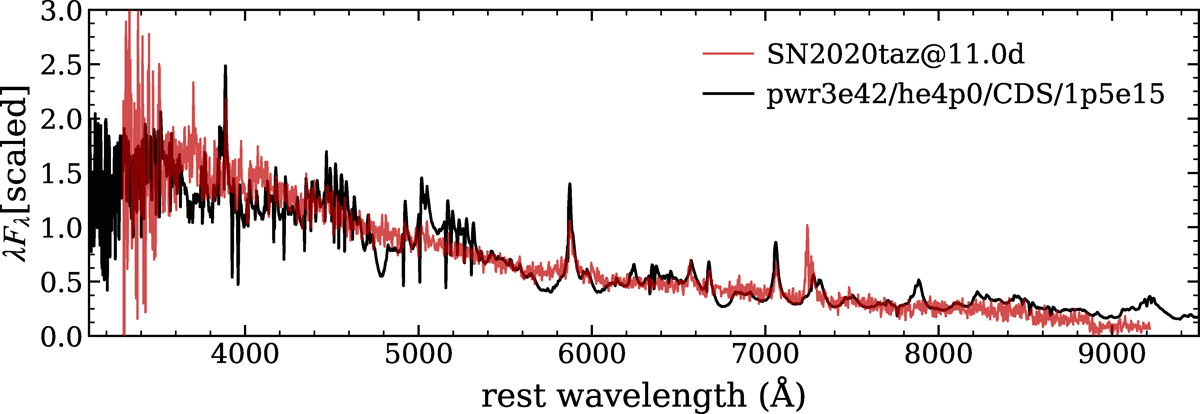
Comparison between the observed spectrum of SN 2020taz obtained on 29 September 2020, corresponding to 11.0 days after the estimated time of maximum light (MJD = 59121.85), and a synthetic spectrum from a CDS model based on he4p0. The model assumes a shell located at a radius of 1.5 × 1015 cm, expanding at a velocity of 500 km s−1, and powered at a rate of 3 × 1042 erg s−1. No smoothing has been applied to either the observed or synthetic spectra. The model spectra were provided by L. Dessart (priv. comm.).
Current usage metrics show cumulative count of Article Views (full-text article views including HTML views, PDF and ePub downloads, according to the available data) and Abstracts Views on Vision4Press platform.
Data correspond to usage on the plateform after 2015. The current usage metrics is available 48-96 hours after online publication and is updated daily on week days.
Initial download of the metrics may take a while.