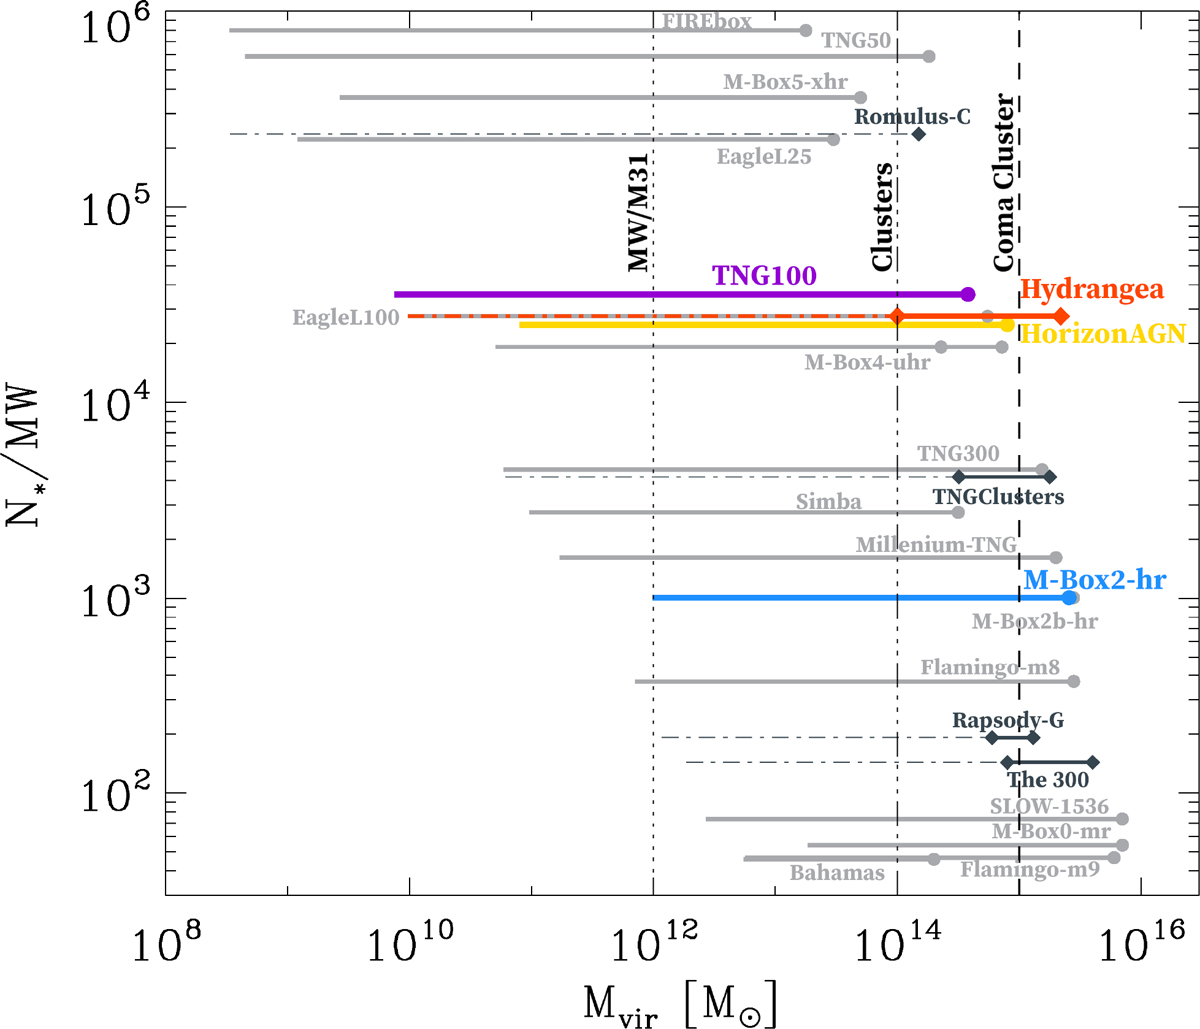
Fig. 1.
Download original image
Number of stellar particles equating to the MW-like stellar mass versus the halo mass covered by the simulation. The simulations used for this study are shown in color, with Magneticum Box2 hr shown in blue, TNG100 shown in purple, Horizon-AGN shown in gold, and Hydrangea shown in orange. Other commonly known simulations are shown in gray. Full box cosmological simulations are in light gray, with Mvir, max(z = 0) indicated by a filled circle while the line goes down to the resolution limit of 1000 dark matter particles. Zoom-in simulations are plotted in dark gray, going from the most massive halo in the set (diamond) down to the same 1000 dark matter particle limit (dashed thin line). Vertical dotted lines mark the MW halo mass, the 1014 M⊙ mass threshold used to define clusters, and the Coma cluster mass. Full box simulation suites shown are: Magneticum Pathfinder (Dolag et al. 2025), IllustrisTNG (Nelson et al. 2019b), Horizon-AGN (Dubois et al. 2014), SLOW (Dolag et al. 2023; Seidel et al. 2024), EAGLE (Schaye et al. 2015), Flamingo (Schaye et al. 2023), Millenium-TNG (Pakmor et al. 2023), and Bahamas (McCarthy et al. 2017). Zoom-in simulation suites shown are: Hydrangea (Bahé et al. 2017), Romulus-C (Tremmel et al. 2019), TNG-Clusters (Nelson et al. 2024), Rapsody-G (Hahn et al. 2017), and The300 Project (Cui et al. 2018).
Current usage metrics show cumulative count of Article Views (full-text article views including HTML views, PDF and ePub downloads, according to the available data) and Abstracts Views on Vision4Press platform.
Data correspond to usage on the plateform after 2015. The current usage metrics is available 48-96 hours after online publication and is updated daily on week days.
Initial download of the metrics may take a while.