Fig. 11.
Download original image
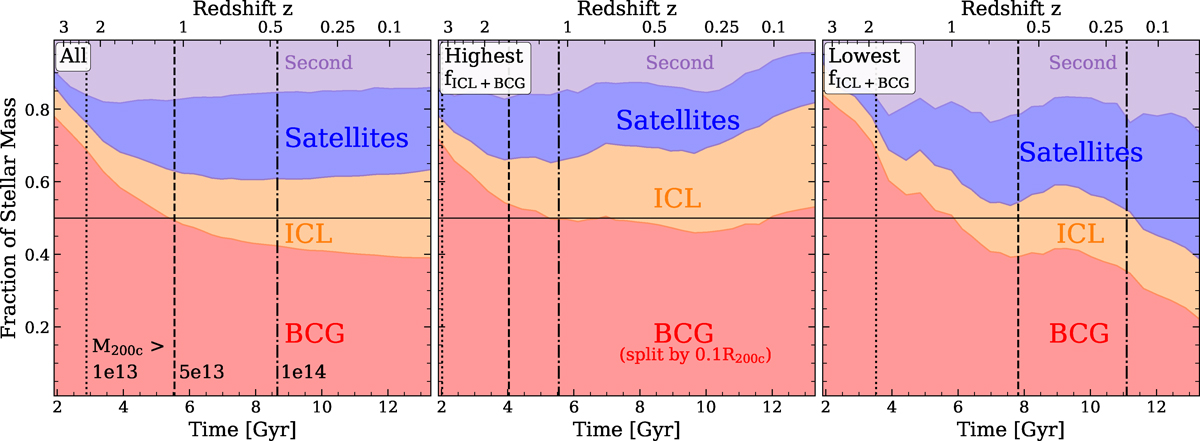
Fraction of the total stellar mass contained in the different components of the Magneticum Box2 hr galaxy clusters versus time, determined for all clusters (left panel) and for the 50 clusters with the highest (central panel) and the 50 clusters with the lowest fICL + BCG for their halo mass (right panel). The fraction of stellar mass contained within the BCG is shown in red, while the fraction in the ICL, the second most massive satellite, and all other satellites are plotted in gold, violet and blue, respectively. The black vertical lines mark the times when the median mass of each group of galaxy clusters is M200, cri > 1 × 10¹³ M⊙ (dotted), M200, cri > 5 × 10¹³ M⊙ (dashed), and M200, cri > 1 × 10¹⁴ M⊙ (dash-dotted). We note that here we split the BCG and ICL at 0.1 × R200, cri. For different definitions of the split between the ICL and the BCG, see Fig. B.2 in the Appendix.
Current usage metrics show cumulative count of Article Views (full-text article views including HTML views, PDF and ePub downloads, according to the available data) and Abstracts Views on Vision4Press platform.
Data correspond to usage on the plateform after 2015. The current usage metrics is available 48-96 hours after online publication and is updated daily on week days.
Initial download of the metrics may take a while.