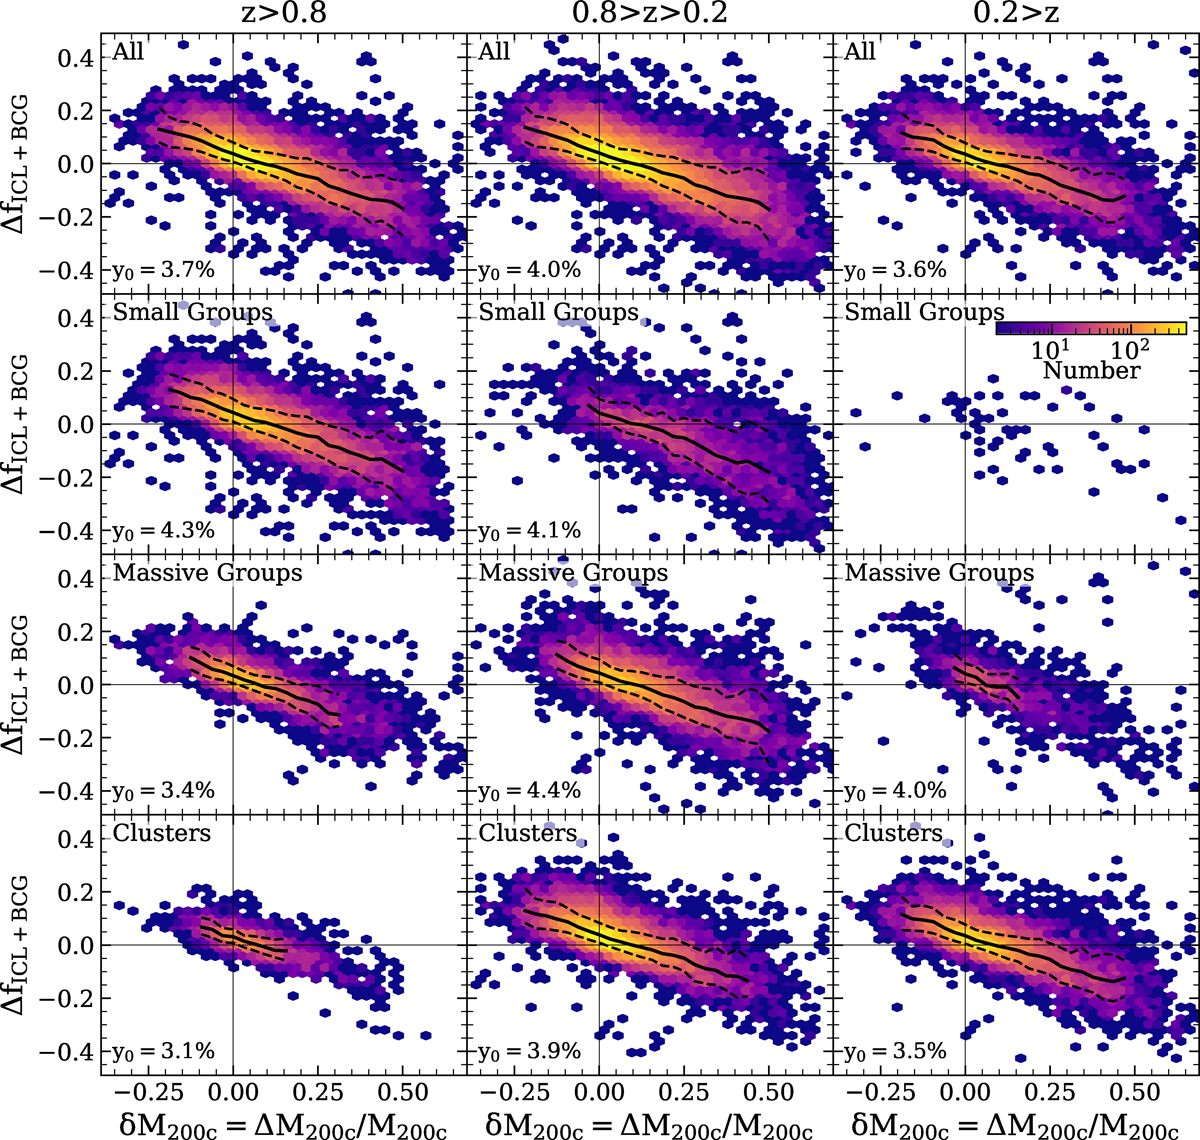
Fig. 12.
Download original image
Absolute change in fICL + BCG versus the relative change in mass δM200c as determined over a period of T = 1 Gyr for the Magneticum clusters. Columns from left to right split the sample into redshift bins, while the rows separate the clusters based on their current mass, going from all clusters in the top row to small and massive groups and finally clusters on the bottom row. The median line and 1σ-bounds are plotted in black, while the thin vertical and horizontal black lines show the location of zero change in either fICL + BCG or cluster mass. y0 indicated in each panel is the median change in fICL + BCG for halos where the total mass did not change, δM200c = 0.
Current usage metrics show cumulative count of Article Views (full-text article views including HTML views, PDF and ePub downloads, according to the available data) and Abstracts Views on Vision4Press platform.
Data correspond to usage on the plateform after 2015. The current usage metrics is available 48-96 hours after online publication and is updated daily on week days.
Initial download of the metrics may take a while.