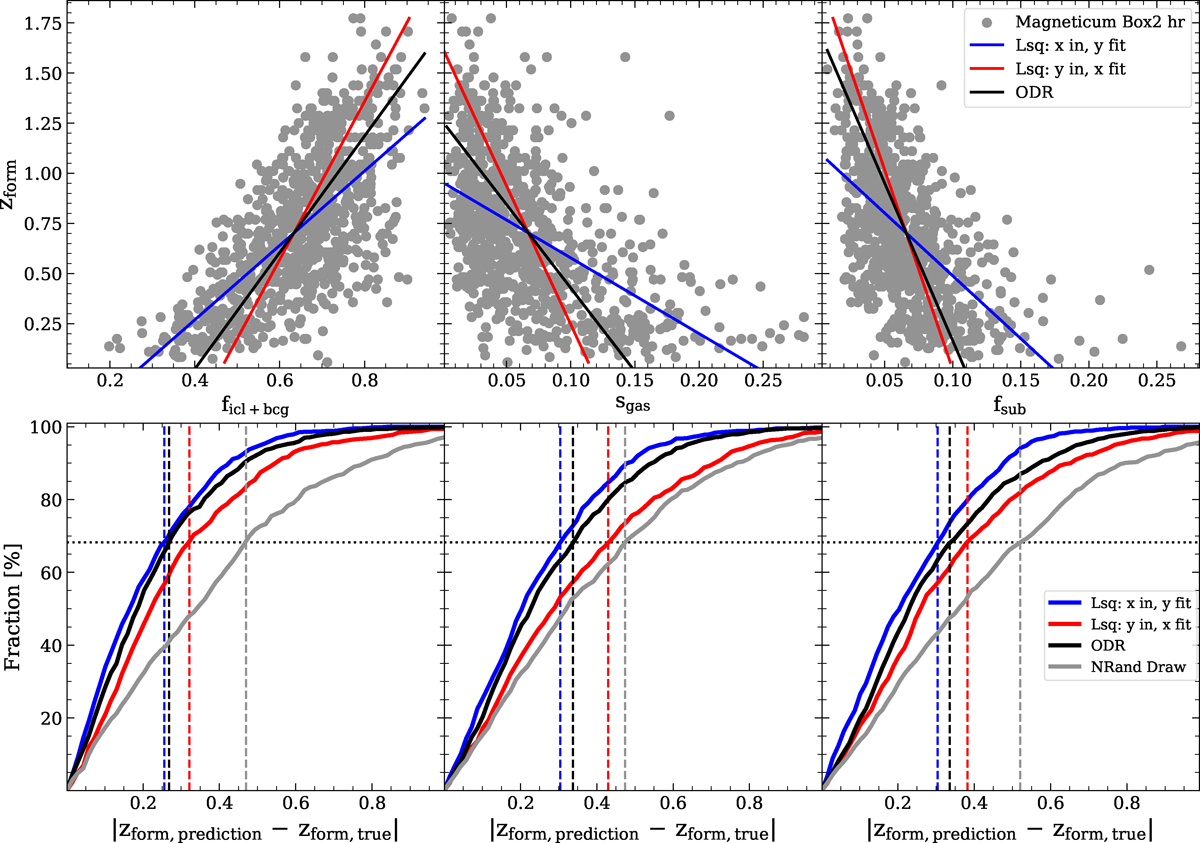
Fig. A.2.
Download original image
Top row: The Magneticum data as in Fig. 7, with the axes swapped. Solid lines show the best fits using either the least-squares method, fitting toward x (red) or y (blue), as well as the best fit using orthogonal distance regression (black). Bottom row: Cumulative histogram of the absolute offset between the predicted versus actual formation redshifts for the three best fit lines, as well as when drawing randomly from a normal distribution of formation redshifts with the mean and standard deviation calculated from the total sample of clusters (gray). The 1σ-bounds (68.27%) are shown as colored vertical lines.
Current usage metrics show cumulative count of Article Views (full-text article views including HTML views, PDF and ePub downloads, according to the available data) and Abstracts Views on Vision4Press platform.
Data correspond to usage on the plateform after 2015. The current usage metrics is available 48-96 hours after online publication and is updated daily on week days.
Initial download of the metrics may take a while.