Fig. 2.
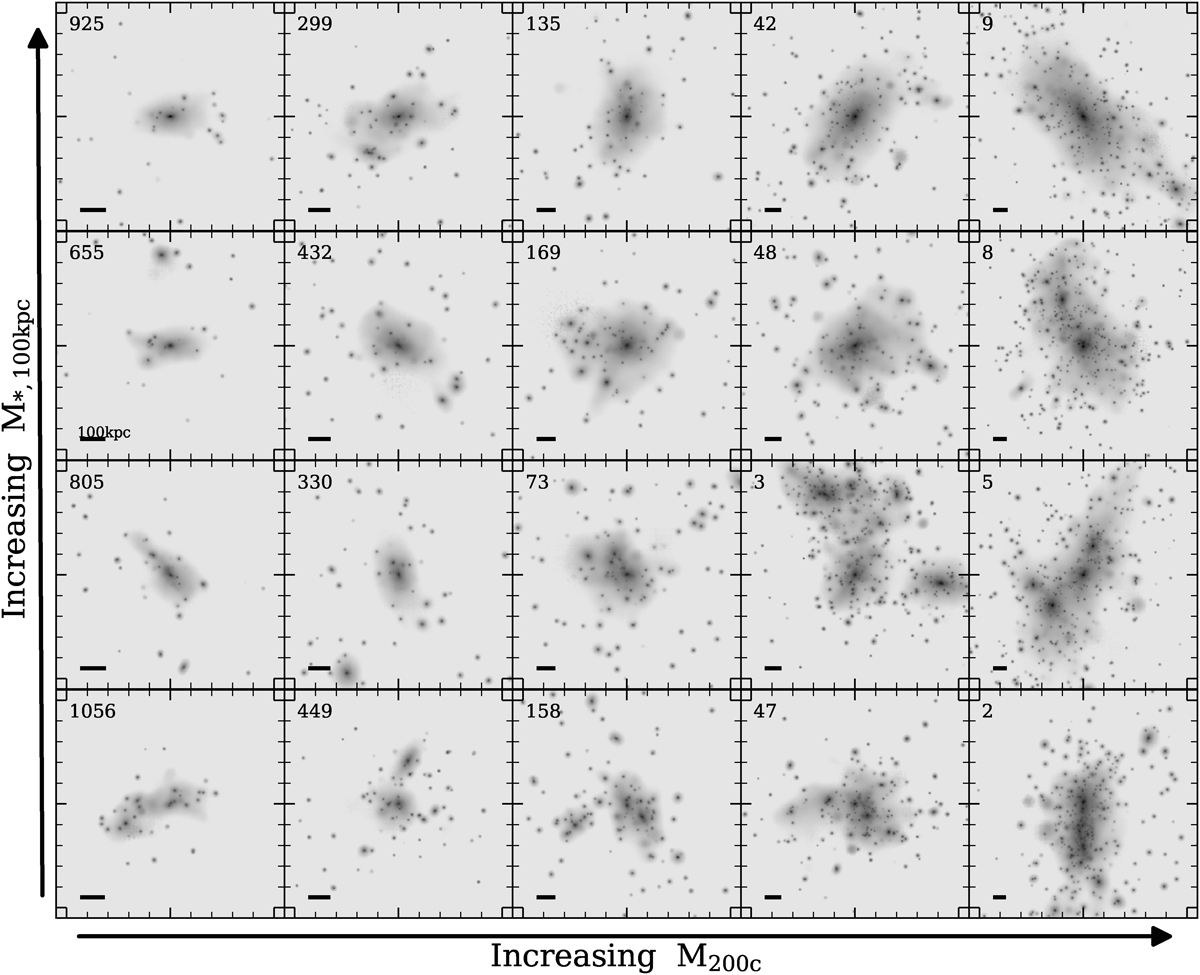
Download original image
Mock images in the r-band of example galaxy clusters from the Magneticum Box2 hr simulation in a random projection, with increasing mass from left to right and cluster IDs indicated in the top left. Clusters in the left column have about M200c = 1 × 10¹⁴ M⊙, with clusters on the right having M200c > 1 × 10¹⁵ M⊙. From top to bottom we plot galaxy clusters with decreasing BCG stellar mass (within 100 kpc, excising satellites) within a narrow bin of cluster halo mass. Each panel shows the full R200c size of the cluster, with the black line in the bottom left of each panel marking the effective length of 100 kpc while the axes ticks are in units of 0.2r200c.
Current usage metrics show cumulative count of Article Views (full-text article views including HTML views, PDF and ePub downloads, according to the available data) and Abstracts Views on Vision4Press platform.
Data correspond to usage on the plateform after 2015. The current usage metrics is available 48-96 hours after online publication and is updated daily on week days.
Initial download of the metrics may take a while.