Fig. 3.
Download original image
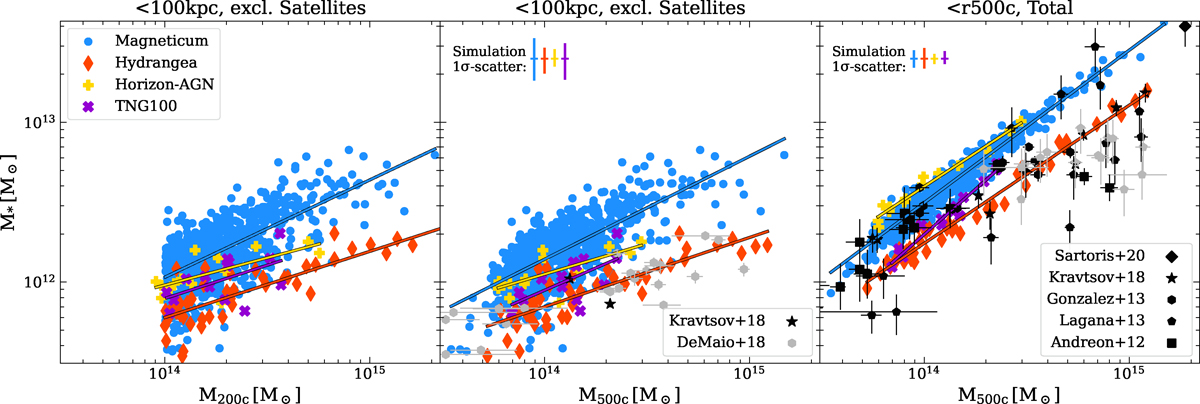
Left: Stellar mass of the central BCG within 100 kpc versus the total halo mass M200c for the four simulations, scaled to a common h. Magneticum is plotted in blue, IllustrisTNG in purple, Hydrangea in orange and Horizon-AGN in gold. Center: Same stellar mass plotted against the halo mass as given by M500c. Also plotted are observations by DeMaio et al. (2018) and Kravtsov et al. (2018). Right: Total stellar mass (BCG, ICL and satellites) against M500c for the simulations, as well as observations by Andreon (2012), Laganá et al. (2013), Gonzalez et al. (2013), Budzynski et al. (2014), Kravtsov et al. (2018), Sartoris et al. (2020).
Current usage metrics show cumulative count of Article Views (full-text article views including HTML views, PDF and ePub downloads, according to the available data) and Abstracts Views on Vision4Press platform.
Data correspond to usage on the plateform after 2015. The current usage metrics is available 48-96 hours after online publication and is updated daily on week days.
Initial download of the metrics may take a while.