Fig. 5.
Download original image
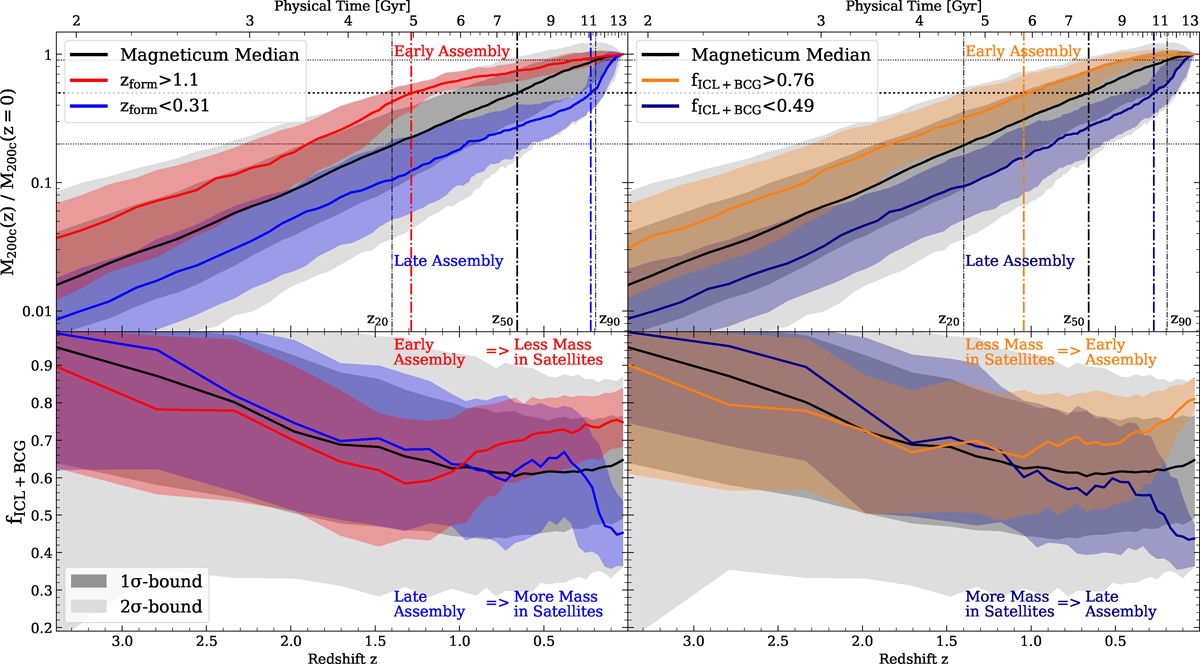
Upper row: Evolution of the halo mass M200, c with redshift z for all clusters in the Magneticum Box2 hr simulation, normalized to the final mass M200, c(z = 0). The black line shows the median, with the dark shaded area marking the 1σ-bounds and the light shaded area marking the 2σ-bounds. The colored lines and their 1σ-bounds show the evolution of a subset of clusters split by their formation redshift (left) or their fICL + BCG (right) as given in the legend. Black dash-dotted vertical lines mark the redshifts at which the average cluster has accumulated 20%, 50%, and 90% of its total mass (horizontal black lines), marked by z20, z50, and z90, respectively. We note that z50 is what we define as formation redshift of a cluster. Lower row: Evolution of fICL + BCG with redshift z. As in the upper panel, the black line marks the average evolution of all clusters from Magneticum, with the gray shaded areas showing the 1σ- and 2σ-bounds. The colored lines and regions show the median and 1σ-bounds for the same subsets of galaxy clusters.
Current usage metrics show cumulative count of Article Views (full-text article views including HTML views, PDF and ePub downloads, according to the available data) and Abstracts Views on Vision4Press platform.
Data correspond to usage on the plateform after 2015. The current usage metrics is available 48-96 hours after online publication and is updated daily on week days.
Initial download of the metrics may take a while.