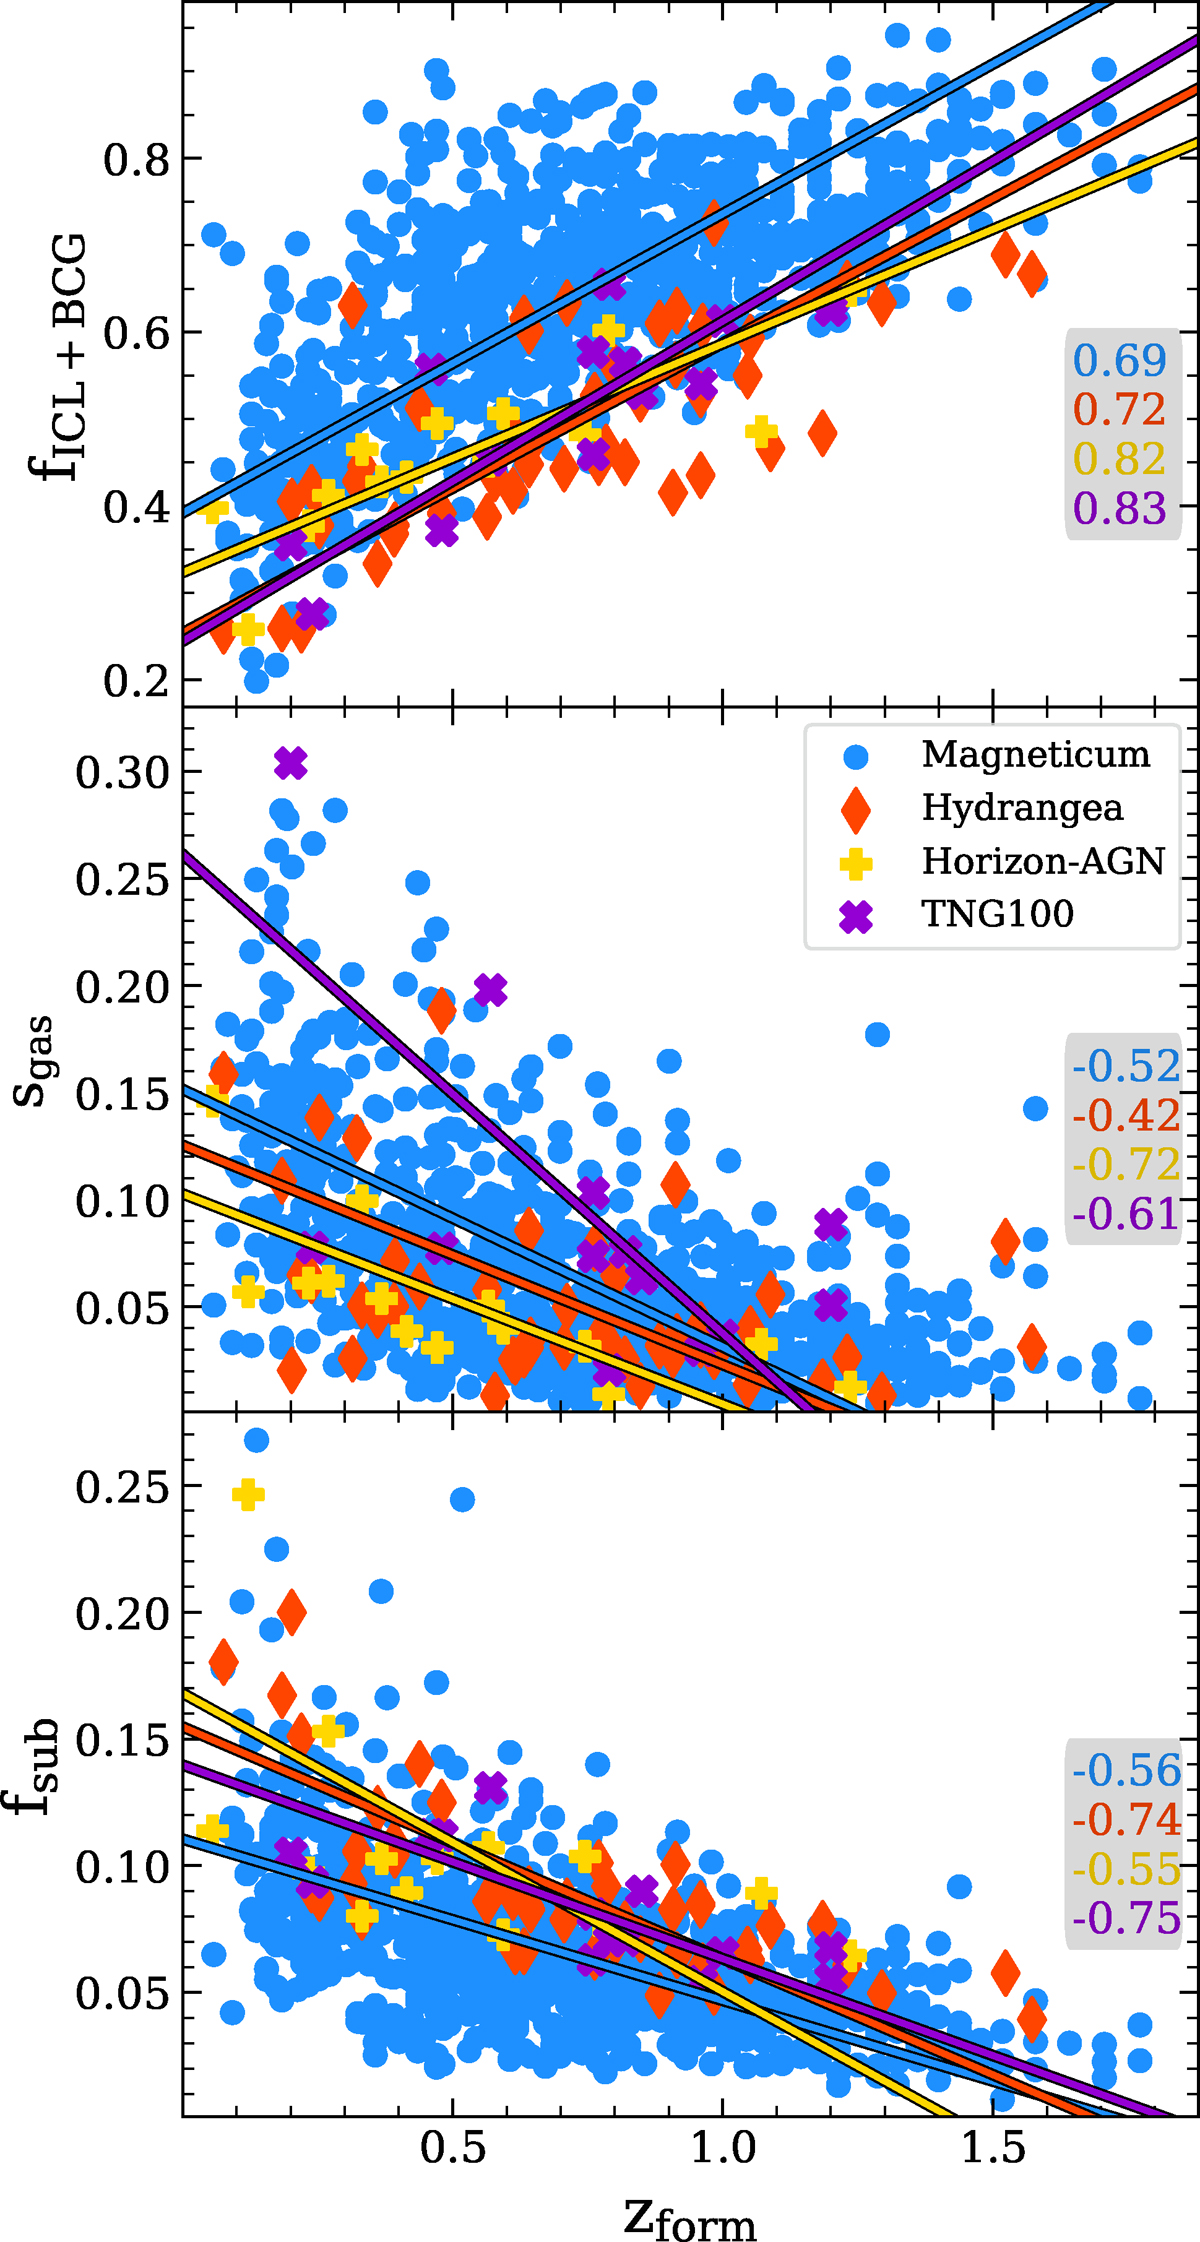
Fig. 7.
Download original image
Upper panel:fICL + BCG versus formation redshift zform, for the galaxy clusters from the Magneticum (blue), TNG100 (purple), Horizon-AGN (gold), and Hydrangea simulations (orange). The gray box displays the Pearson correlation coefficient for each simulation between fICL + BCG and zform. The closer the absolute value is to unity, the tighter the correlation. We further include best fit lines for each simulation determined via the least squares method (colored lines). Middle panel: Center shift between the 3D gas barycenter and the location of the BCG (normalized by R200c), plotted as a function of the formation redshift, with the colors the same as the upper panel. Lower panel: Fraction of the total halo mass mass which is in all subhalos fsub (so excluding the central and diffuse halo) versus formation redshift, with colors as in the upper two panels.
Current usage metrics show cumulative count of Article Views (full-text article views including HTML views, PDF and ePub downloads, according to the available data) and Abstracts Views on Vision4Press platform.
Data correspond to usage on the plateform after 2015. The current usage metrics is available 48-96 hours after online publication and is updated daily on week days.
Initial download of the metrics may take a while.