Fig. 9.
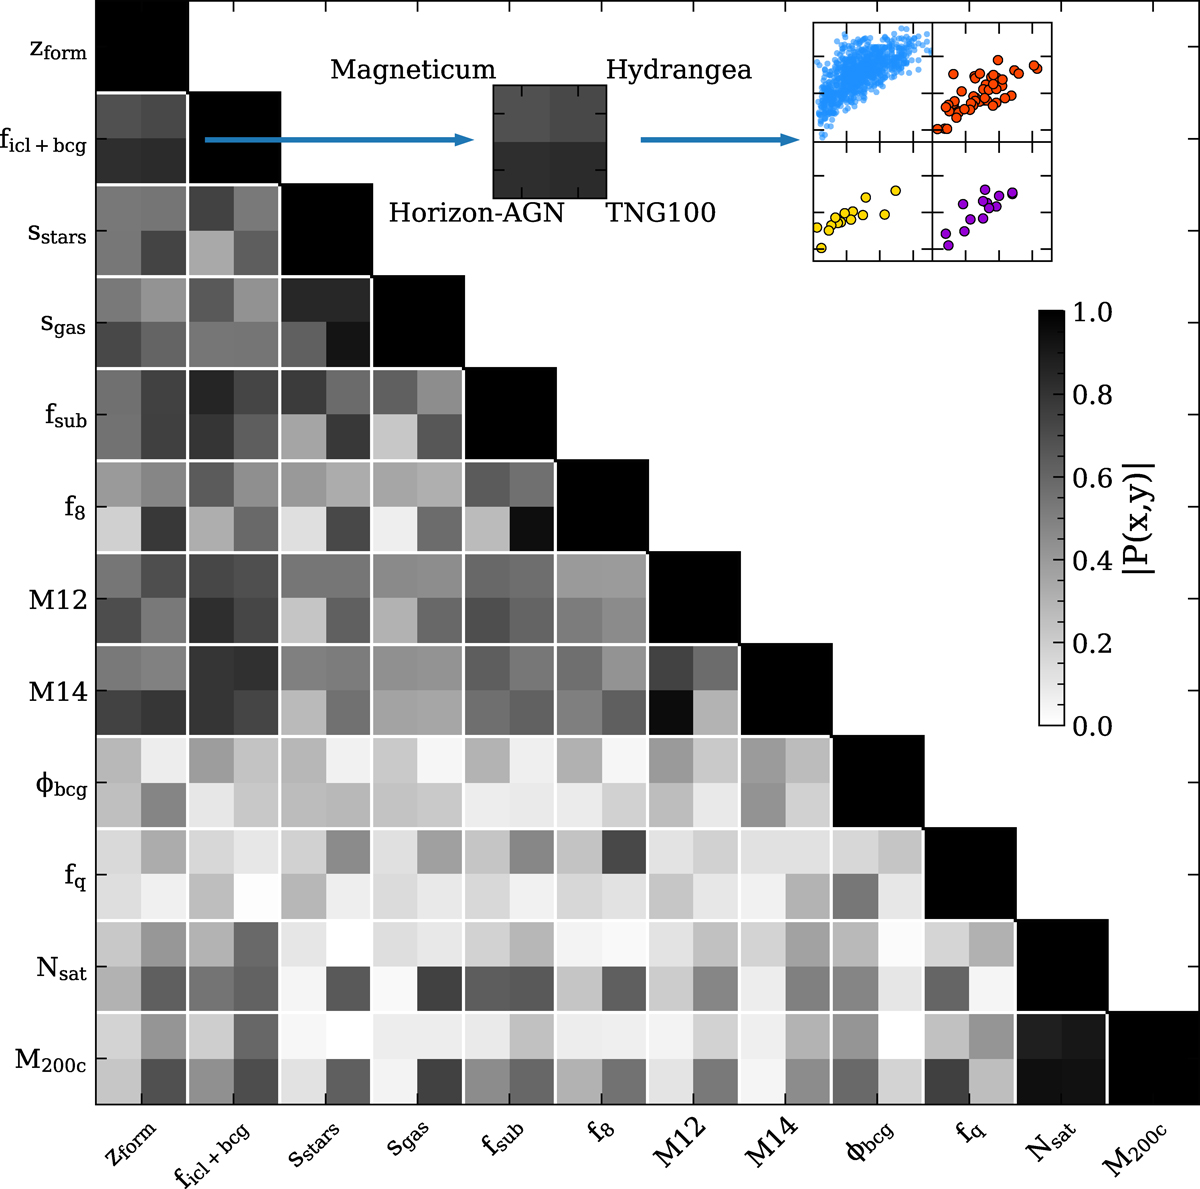
Download original image
Full matrix of the correlation strength between different parameters, with darker colors indicating stronger correlations, for all four simulations as indicated at the respective tiles for each panel. From top to bottom and left to right are the same parameters, in the following order: formation redshift zform, the fraction of stellar mass within ICL plus BCG fICL + BCG, the center shift between the stellar (sstars) or gas barycenter (sgas) and the BCG, the fraction of total mass within all substructures fsub or within just the 8th most massive substructure f8, the stellar mass ratio between the BCG and the second (M12) or fourth (M14) most massive galaxy in a cluster, the central stellar potential ϕBCG, the passive fraction fquench of galaxies in the cluster with stellar masses above 1 × 10¹⁰ M⊙ as well as their total number Nsat, and the total halo mass M200c. We note that black squares in the diagonal mark the self-correlation of the parameters and are thus all equal to one.
Current usage metrics show cumulative count of Article Views (full-text article views including HTML views, PDF and ePub downloads, according to the available data) and Abstracts Views on Vision4Press platform.
Data correspond to usage on the plateform after 2015. The current usage metrics is available 48-96 hours after online publication and is updated daily on week days.
Initial download of the metrics may take a while.