Fig. 3
Download original image
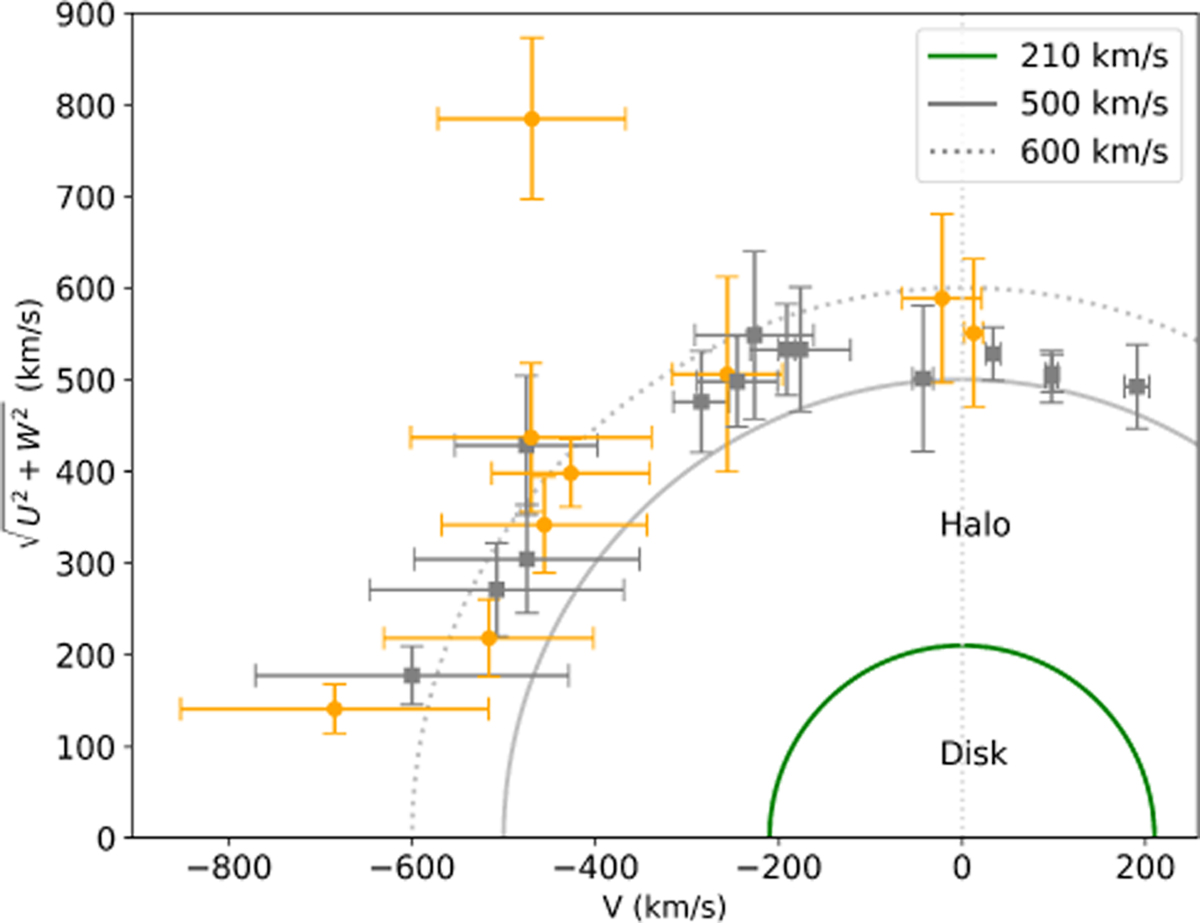
Toomre diagram showing the kinematic distribution of our stars in the (V, ![]() ) plane. The solid green curve represents a total space velocity of 210 km s-1, approximately delimiting the thick-disk and halo populations (Gaia Collaboration 2023a), while the solid and dotted gray curves mark the 500 and 600 km s-1 contours, respectively. Objects highlighted in orange correspond to those identified as having an extragalactic origin in this work. The target with the highest
) plane. The solid green curve represents a total space velocity of 210 km s-1, approximately delimiting the thick-disk and halo populations (Gaia Collaboration 2023a), while the solid and dotted gray curves mark the 500 and 600 km s-1 contours, respectively. Objects highlighted in orange correspond to those identified as having an extragalactic origin in this work. The target with the highest ![]() value is HVS01.
value is HVS01.
Current usage metrics show cumulative count of Article Views (full-text article views including HTML views, PDF and ePub downloads, according to the available data) and Abstracts Views on Vision4Press platform.
Data correspond to usage on the plateform after 2015. The current usage metrics is available 48-96 hours after online publication and is updated daily on week days.
Initial download of the metrics may take a while.