| Issue |
A&A
Volume 700, August 2025
|
|
|---|---|---|
| Article Number | A172 | |
| Number of page(s) | 10 | |
| Section | Galactic structure, stellar clusters and populations | |
| DOI | https://doi.org/10.1051/0004-6361/202554784 | |
| Published online | 15 August 2025 | |
Searching for new hypervelocity stars with Gaia DR3 and VLT/FORS2 spectroscopy★
1
Instituto de Alta Investigación, Universidad de Tarapacá, Casilla 7D, Arica, Chile
2
National Astronomical Observatory of Japan, Mitaka-shi, Tokyo 181-8588, Japan
3
European Southern Observatory, Alonso de Córdova 3107, Vitacura, Santiago, Chile
4
Université Côte d’Azur, Observatoire de la Côte d’Azur, CNRS, Laboratoire Lagrange, Bd de l’Observatoire, CS 34229, 06304, Nice Cedex 4, France
5
Institut de Ciències del Cosmos (ICCUB), Universitat de Barcelona (UB), Martí i Franquès 1, 08028 Barcelona, Spain
6
Departament de Física Quàntica i Astrofísica (FQA), Universitat de Barcelona (UB), Martí i Franquès 1, 08028 Barcelona, Spain
7
Institut d’Estudis Espacials de Catalunya (IEEC), c. Gran Capità, 2-4, 08034 Barcelona, Spain
8
Vicerrectoría de Investigación y Postgrado, Universidad de La Serena, La Serena 1700000, Chile
9
Las Campanas Observatory, Carnegie Observatories, Casilla 601, La Serena 7820436, Chile
★★ Corresponding author: This email address is being protected from spambots. You need JavaScript enabled to view it.
Received:
27
March
2025
Accepted:
26
June
2025
Abstract
Context. Hypervelocity stars are unique objects that move through the Milky Way at speeds exceeding the local escape velocity. They provide valuable insights into the gravitational potential of the Galaxy and the properties of its central supermassive black hole. The advent of Gaia DR3 offers an unprecedented astrometric precision that enables the discovery of new hypervelocity stars and facilitates their characterization.
Aims. This study seeks to identify and characterize hypervelocity star candidates using Gaia DR3 data. We focus on stars without radial velocity measurements. Our goal was to estimate the total velocities of these stars and establish their origin within the Galactic framework, if possible.
Methods. We applied strict selection criteria to Gaia DR3 data by focusing on sources with low parallax uncertainties and high astrometric fidelity. The distributions of the total velocities in the Galactic rest frame were derived and used to identify candidates. Spectroscopic follow-up with VLT/FORS2 provided radial velocity measurements for a subset of these candidates. We evaluated the probabilities of stars that exceeded local escape velocities under different Galactic potential models and traced their past orbits to identify possible origins.
Results. From Gaia DR3, we identified 149 hypervelocity star candidates with probabilities Pesc ≥ 50% of exceeding local escape velocities. Our follow-up spectroscopy for 23 of these sources confirmed that the selected targets travel at high velocities, and many appear to escape the Galaxy, depending on the adopted Galactic potential. We found that except for one target with a minimum distance of ~1 kpc within uncertainties, none of the targets seems to have originated at the Galactic center. On the other hand, our analysis suggests that nearly one-third of the stars may have an extragalactic origin. These findings highlight the need for more precise astrometric and spectroscopic data to conclusively determine the origins of hypervelocity stars and to improve models of the Galactic potential.
Key words: astrometry / stars: kinematics and dynamics / Galaxy: general
Based on observations collected at the European Southern Observatory under ESO programs 110.23UC.007 and 111.24P0.006.
© The Authors 2025
 Open Access article, published by EDP Sciences, under the terms of the Creative Commons Attribution License (https://creativecommons.org/licenses/by/4.0), which permits unrestricted use, distribution, and reproduction in any medium, provided the original work is properly cited.
This article is published in open access under the Subscribe to Open model. This email address is being protected from spambots. You need JavaScript enabled to view it. to support open access publication.
1 Introduction
Hypervelocity stars (HVSs), which are traveling across our Galaxy at velocities above the local escape velocity (vesc), have attracted significant attention, as evidenced by the volume of recent studies that focused on these objects. This interest has been driven by the arrival of wide-sky surveys, which provide the necessary data for characterizing the orbits of millions of stars with unprecedented precision (Brown 2015). Between the pioneering work of Hills (1988) and the identification of the first HVS, SDSS J090745.0+02450 (Brown et al. 2005), the field saw mostly theoretical developments. In the past decade, however, the known Galactic population of high-velocity (HiVel) stars has increased by hundreds, including several dozen confirmed HVSs. Although there is no universally adopted definition of a HiVel star, they are generally considered to be objects with total galac-tocentric velocities above ∼300-400 km s-1 (e.g. Du et al. 2018; Hattori et al. 2018; Quispe-Huaynasi et al. 2022).
The main mechanism for generating HVSs is the so-called Hills mechanism (Hills 1988; Yu & Tremaine 2003), which predicts that one of the members in a binary star system might be ejected and reach such velocities during the interaction with the supermassive black hole (SMBH) at the center of our Galaxy (Event Horizon Telescope Collaboration 2022). Only a few confirmed HVSs appear to originate from the inner regions of the Milky Way (MW) when their orbits are traced back in time, however (e.g. Koposov et al. 2020). Interestingly, Chu et al. (2023) found a lower binary fraction in the surroundings of the Galactic SMBH (47 versus 70% in the field), which is consistent with the scenario in which the SMBH plays a relevant role in the disruption of binary systems. Although some bound HiVels originating from the MW center have been reported in the literature (e.g. Hattori et al. 2025), we reserve the term HVS in this work exclusively to refer to unbound stars. Liao et al. (2023) proposed that a close encounter between a single star and the SMBH might also produce a HVS, but in a regime of rates and/or luminosities that makes their detection more difficult. Orbitally decayed globular clusters may also contribute to HVSs after a close encounter with the central SMBH (Capuzzo-Dolcetta & Fragione 2015; Fragione & Capuzzo-Dolcetta 2016). Numerical simulations also showed that intermediate-mass black holes (IMBHs) that sink to the center of the Galaxy may accelerate stars (Baumgardt et al. 2006).
Alternatively, HVSs might originate in the disruption of accreted MW satellite dwarf galaxies (Abadi et al. 2009; Piffl et al. 2011), where stars are stripped from their progenitor galaxy during its pericentric passage, close to the Galactic center, and pushed into high-velocity orbits. Recent studies (Li et al. 2022; Huang et al. 2021) have indeed shown that ∼60 HiVels, some of them possibly HVSs, originated in the Sagittarius dwarf galaxy (see also Du et al. 2018, 2019; Montanari et al. 2019). Even the Magellanic Clouds seem to be a tentative birth place for these runners because a few distant stars have previous orbits that point toward them (Edelmann et al. 2005; Irrgang et al. 2018; Erkal et al. 2019; Lin et al. 2023). It was recently proved that it is theoretically possible for a HVS that originated in the Andromeda galaxy to reach the MW (Gülzow et al. 2024). Other violent scenarios, such as a supernova explosion in a binary system from which the companion star is ejected, may also produce HVSs, although most of them are HiVels, with total velocities of a few hundred km s-1 (e.g. Irrgang et al. 2021; Ruiz-Lapuente et al. 2023). The latter process might cause the so-called runaway stars, which are ejected from the Galactic disk without interaction with the SMBH (Silva & Napiwotzki 2011).
The search for these peculiar stars is of interest not only because of the discovery itself, but also to understand the nature of the central SMBH and the mass distribution of the sections of the MW they cross (e.g. see Gallo et al. 2022, and references therein). Since the expected number (Yu & Tremaine 2003; Brown et al. 2014) and the fraction of HVSs generated via the different mechanisms described above is unknown, the search has continued since the one discovered by Brown et al. (2005) through dedicated (or serendipitous) observational campaigns that revealed the dozens of HVSs in the Galactic halo (e.g. Hirsch et al. 2005; Brown et al. 2006; Gualandris & Zwart 2007; Tillich et al. 2009; Brown et al. 2010, 2014; Koposov et al. 2020; Burgasser et al. 2024; Verberne et al. 2024).
The arrival of the European Space Mission Gaia (Gaia Collaboration 2016, 2018a, 2023b) represents a revolution for this field because for the first time, we have access to precise astrometric information (coordinates, distances, and proper motions) and radial velocities (vlos) for a significant number of sources in our Galaxy. This unprecedented dataset enables a detailed study of past and present orbits of HVS candidates. In this context, the identification of more of these travelers, which are excellent stellar probes from the inner regions of the MW (Contigiani et al. 2019; Evans et al. 2022), was among the many potential applications proposed for Gaia datasets following its first data release (see Marchetti et al. 2017, 2018). Since then, the successive Gaia data releases have been mined in the search for HVS candidates (e.g. Du et al. 2018; Generozov 2020; Li et al. 2022; Liao et al. 2023; Marchetti et al. 2022; Li et al. 2021; Marchetti et al. 2019; Boubert et al. 2018; Scholz 2024).
Despite the tremendous advancement in the discovery and study of Galactic HVSs, the uncertainties associated with the astrometric parameters still affect our ability to identify these fast travelers. It is still hard to infer the location within the Galaxy in which these stars gained enough energy to escape for a significant fraction of HVS candidates. In the case of Gaia, the parallax and proper motions errors for faint sources, together with the lack of measured vlos for most of the objects, hampers our attempts to find new HVSs, and more importantly, to compute their past orbits to study the importance of the different proposed ejection mechanisms.
With this paper, we intend to contribute to the census of known Galactic unbound HVS candidates by combining Gaia data with ground-based follow-up spectroscopy for the sources that likely move at velocities above vesc. This will allow us not only to confirm their total velocities, but to search for their ejection location within the MW.
2 Method. Sample of HVS candidates
Our main goal with this work was to identify HVS candidates whose orbits cannot be reconstructed due to the lack of vlos. Therefore, we excluded all sources for which vlos was provided by Gaia from our analysis and assumed that the hypothetical HVSs in Gaia DR3 have already been identified in previous studies if their vlos were known. We focus on high-quality astrometry sources with incomplete Gaia information in the 6D phase space.
First, we restricted our sample to stars whose parallaxes have relatively low associated uncertainties by only including sources with σϖ/ϖ ≤ 0.2. This limit, combined with additional quality cuts, allowed us to derive heliocentric distances from the inversion of parallaxes alone, although we verified that other estimates (e.g. Bailer-Jones et al. 2021) are consistent within errors. We also used two parameters that account for the quality of the parameters provided by Gaia for a given source: the renormalized unit weight error (RUWE; see description in Lindegren et al. 2021b), for which we set the usual limit of RUWE < 1.4, and the astrometric fidelity parameter proposed by Rybizki et al. (2022), namely fidelity_v2, which classifies Gaia sources using neural network models trained on a dataset of good and bad sources. For this parameter, we adopted a minimum threshold of 0.5. The parallax zeropoint values were derived following the recipe by Lindegren et al. (2021a)1.
For each of the ∼190 million stars that met our quality criteria, we derived 1000 estimates of the total velocity (vT) in the Galactic standard of rest frame using a multivariate Gaussian distribution. This distribution accounts for the parameters provided by Gaia and their associated uncertainties. The covariance matrix describing the uncertainties and correlations between the measured astrometric parameters (ρ) is:

where σµα, σµδ, and σϖ are the uncertainties associated with µα, µδ, and ϖ, respectively. Uncertainties related to sky positions were assumed to be negligible.
For each iteration, we estimated the hypothetical heliocentric radial velocity (vlos0) that minimized vT, which varies with the position within the Galaxy (e.g., vlos0 = 0 km s-1 for stars around ℓ = 180°). This means that although we refer to these values as total velocities, they are actually minimum total velocities. Thus, this approach provides a conservative method for identifying HVS candidates when assuming vlos0 to derive their total velocities.
Throughout this calculation, the distance from the Sun to the Galactic center and to the plane were set at 8.2 and 0.025 kpc, respectively (Bland-Hawthorn & Gerhard 2016). The solar velocity vector was set at v⊙ = [11.1,232.2,7.25] km s-1 (Schönrich et al. 2010; Bovy et al. 2012). For each of the iterations (i.e., positions within the Galaxy), we derived the vesc in the MWPotential2014 potential provided by GALPY (see description in Bovy 2015) and assumed that vesc is independent of z (our values at any R correspond to z = 0 kpc). We verified that for most of the sources, the dispersion in vesc remained below 2 kms-1. The vesc values depend on the selected Galactic potential, although we assumed that this effect is negligible in a first approach (see the discussion in Section 4.2).
The fraction of realizations where vT > vesc is considered an estimate of the probability (Pesc) of being a HVS. Since it is only possible to compute the real probability when vlos is known, we denote this initial estimate Pesc,0. Figure 1 illustrates how we computed the probability for two HVS candidates with a similar median vesc ~ 500km s-1. While for one of the stars, the vT distribution lies almost completely below vesc (Pesc,0 = 10%), the second vT distribution is associated with a star with Pesc,0 ~ 75%. In both cases, it would only be possible to confirm their nature when we obtain reliable vlos and derive their 3D velocity vectors.
Our final sample of candidates, with Pesc,0 ≥ 50%, contains 149 sources, whose Galactic distribution is shown in Figure 2. As expected, the basic quality cuts we applied to the Gaia data restricted our sample to nearby objects (~40% within 2kpc from the Sun), and ~70% of them are immersed in the Galactic disk assuming a height scale of 1 kpc (e.g. Bland-Hawthorn & Gerhard 2016). Despite the quality criteria we applied, however, a few spurious sources might still remain in our sample. To further assess the astrometric reliability, we followed the additional recommendations by Scholz (2024) for identifying HVS candidates with the most robust solutions. We crossmatched our sources between Gaia DR2 and DR3 to identify any significant discrepancies in proper motions and parallaxes. Additional quality checks included verifying the absence of nearby neighbors, ensuring a high number of individual observations, and confirming the lack of astrometric warning flags in Gaia DR3.
Out of the 149 sources, 36 did not pass these final quality criteria. We therefore classified them as part of a silver subsample, whereas the remaining 113 stars constitute the astrometrically reliable golden subsample. We analyzed all targets regardless of this classification, but the distinction is important when the robustness of the HVS nature of each candidate is evaluated. Even though not all stars in the golden sample turn out to be true HVSs, the number of candidates remains significant given the stringent quality cuts we applied during the selection.
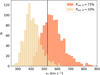 |
Fig. 1 vT distribution from 1000 realizations for two HVS candidates with similar median vesc (~500 km s-1; vertical blue line). The yellow and orange distributions are associated with stars with initial escape probabilities of Pesc,0 = 10 and 75%, respectively. |
3 Spectroscopic follow-up with FORS2
We focused on HVS candidates that lacked Gaia-provided vlos estimates. Even though their transverse velocities (vt2) suggest a total galactocentric velocity above the local vesc value, however, the origin of the stars cannot be established without full 6D phase-space information. We therefore continued our study by deriving vlos from follow-up spectroscopy for a subset of candidates.
A selection of relatively bright HVS candidates from the golden and silver subsamples, spanning a wide range of Pesc,0 values and observable over two semesters, was chosen for spectroscopic follow-up (see Table 1). Three of them, namely HVS01, HVS02, and HVS03, have previously been proposed as HVSs based on their vt alone (Du et al. 2019; Scholz 2024), and we therefore included them in our sample to derive their vlos and investigate their origin within the Galaxy. Six targets with Pesc,0 below 50% were incorrectly included in the preliminary list (Pesc,0 values changed after a modification of our HVS identification procedure), but we used them here as control stars3.
It is important to note that HVS01 was excluded by Scholz (2024) and has been classified as a carbon-enhanced metal-poor (CEMP) star candidate (Li et al. 2018; Fang et al. 2025). Because certain types of CEMP-s stars are known to exhibit radial velocity variability as a result of binarity (e.g. Placco et al. 2014; Starkenburg et al. 2014), caution is advised when interpreting the properties of this object. Nevertheless, we retained HVS01 in our sample because peculiar stars like this are relevant for studies in Galactic archaeology. HVS20 was classified as a c-type RR Lyrae by Gaia (Clementini et al. 2023; Eyer et al. 2023), with an amplitude of ~0.4 mag in G band and a period of ~7 h. The variability of HVS20 might impact the determination of vlos and introduce an error of up to ~25km s-1 (see Prudil et al. 2024, and references therein).
The source magnitudes lay in the range 14.1 < G < 17.4 (see their spatial distribution and their positions in the colormagnitude diagram in Figure 2), and were observed with FORS2 from the Paranal Observatory as part of an all-weather filler program (111.24P0.006, 110.23UC.007). A total of 23 stars were observed, which accounted for a total time of 21.6 h. The observations were acquired in service mode, in the long-slit mode, using the grism 1200R+93 and 1.0 arcsec slit (R ~ 2140). The exposure times ranged from 600 s to 2 × 2400 s (see Table 1). The data were reduced with the FORS2 v5.6.4 reduction pipeline, which included flat fielding, wavelength calibration, correction for spatial distortion, sky subtraction, optimal extraction of spectra, and flux calibration. All spectra were corrected for the heliocentric velocity using MOLLY4. To ensure an accurate wavelength calibration, the spectra were subsequently aligned by referencing the position of the sky emission line at 6300.34 Å. The same emission line was reidentified in the corrected spectra, yielding a mean residual for the centroid of the line better than 5% of the spectral dispersion across the entire sample.
vlos and a rough estimate of [Fe/H] were derived for each star using Doppler.5, which is designed to characterize stars by convolving a model spectrum to the resolution or line spread function (LSF) of the observed spectrum. The uncertainties associated with the parameters are the 1σ of the distributions obtained by bootstrapping the observed spectra 10 000 times. In the same way, a parallel approach with pySME (Wehrhahn et al. 2023) was performed to derive vlos and [Fe/H]. We used typical values for micro- and macroturbulence for dwarf stars, and we used a fixed photometric log g during the fitting process to reduce the number of free parameters. The values agree with Doppler and are consistent for main-sequence stars (see right panel in Figure 2). The low spectral resolution results in considerable uncertainties, however.
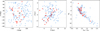 |
Fig. 2 Spatial distribution of the HVS candidates in the ℓ - b and Y - X planes are shown in the left and central panels, respectively. Objects for which we obtained follow-up spectroscopy are marked with red squares. Right: position of the HVS candidates and targets observed in the color-magnitude diagram (absolute magnitudes). |
Sample of HVS candidates selected for follow-spectroscopy.
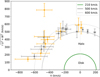 |
Fig. 3 Toomre diagram showing the kinematic distribution of our stars in the (V, |


4 Results and discussion
The probability of being an HVS (Pesc), computed using the vlos derived from FORS2 data, agrees well with the values previously obtained (Pesc,0), as calculated in the absence of vlos measurements. Since the vT distributions previously derived above represent lower limits, Pesc > Pesc,0. Our HVS candidates therefore retained this classification when new information is incorporated. Although a population of HVSs is not expected to follow an isotropic velocity distribution, the fact that vT significantly exceeds  for most of our targets may indicate potentially overestimated proper motion values (see also Palladino et al. 2014; Scholz 2024). While our sources are not necessarily affected by poor astrometry, this observation warrants caution. The kinematics of these targets should be confirmed when future Gaia data releases become available. Nonetheless, as shown in the Toomre diagram (Figure 3), all of our targets exhibit halo-like kinematics, which is expected for these fast-moving objects: In the (V,
  ) plane, all the stars lie beyond the 500 km s-1 contour.
To investigate the origin of our targets, we computed their mean orbital trajectories over the past 1 Gyr, based on 1000 Monte Carlo realizations with a time step of 1 Myr, adopting the MWPotential2014 Galactic potential. We first verify whether any of our HVS candidates might have been produced by the Hills mechanism (Hills 1988), assuming that this is the case of objects whose minimum galactocentric distance along its orbit is r < 1 kpc. This is similar to the criteria used in previous works (e.g. Marchetti et al. 2019; Koposov et al. 2020; Liao et al. 2023).
No object in our sample satisfies this condition, with the exception of HVS07, which has a past orbit that approximates to the inner MW at r ~ 1.4 ± 0.4 kpc from its center, almost 11 Myr ago, when vT = 710 ± 70km s-1. This velocity lies near the lower limit of the range of ejection velocities predicted for intermediate-mass stars that are produced via the Hills mechanism in the vicinity of the Galactic SMBH (e.g. Bromley et al. 2006). While low velocities like this are not excluded, in particular, for intermediate- or low-mass stars, which can remain bound, this nonetheless casts doubt on a Galactic center origin for this HVS candidate.
Although our results may depend on the assumed Galactic potential and be influenced by astrometric uncertainties, they remain consistent with previous systematic studies, which found little evidence supporting a Galactic center origin for HVSs (e.g. Kreuzer et al. 2020; Irrgang et al. 2021). Although there are hundreds of confirmed (and refuted) HVSs, only a few dozen seem to originate close to Sgr A*, and S5-HVS1 is one of the most promising candidates (Koposov et al. 2020). Even though the sample presented in this work is limited, it is therefore clear that the family of Galactic HVSs must have been ejected from other locations within the MW, not necessarily its center.
We classified our targets considering not only their trajectories, but also their current positions within the Galaxy. We grouped the targets into four categories, similar to the scheme proposed by Marchetti et al. (2019): (i) HVSs that are not in the Galactic disk and whose past orbits did not intersect the plane, which we classified as extragalactic star candidates (although halo stars on extremely eccentric orbits may fall into this category); (ii) HVSs whose past orbits did not intersect the plane (b = 0°), but that are currently located within the Galactic disk (|z| ≤ 1 kpc); (iii) HVSs whose past orbits intersected the MW disk; and (iv) stars with a low probability of being a HVS, but that are still HiVel stars. With these basic definitions, we assumed that HVSs whose past orbits crossed the Galactic disk might originate in this dense MW component, although it is not possible to completely rule out an extragalactic origin for them. The suggested classification is also included in Table 2, while their recent past orbits and current positions within the Galaxy are shown in Figure 4. We include in the table under the category “disk crossing” only those stars whose past orbits intersected the Galactic plane in more than half of the realizations.
The past orbits of the fastest star in our sample (HV01; vT ~ 900 km s-1 ) and another seven targets throughout the Galaxy do not intersect the Galactic plane during the past 1 Gyr. The only exception is HVS02, which crossed the Galactic disk approximately 8 Myr ago, but at a galactocentric distance of R ~ 50 kpc. Although the exact extent of the Galactic disk remains uncertain (e.g. Lian et al. 2024), several HVSs have been discovered in the outer disk at R > 20 kpc, suggesting a possible connection with the impact of satellite galaxies (Irrgang et al. 2021). We therefore also classified HVS02 as a tentative extragalactic star.
All these stars, except for HVS06, are on retrograde orbits around the Galaxy (see Figure 3), which has been considered an indication (in combination with other indicators) of the possible extragalactic origin of globular clusters and stars within the MW (e.g. Koppelman et al. 2019; Matsuno et al. 2019; Myeong et al. 2019). This observation strengthens our classification, but they might still be in situ formed halo stars, and the role of the bars in the production of stars on retrograde orbits remains unclear (Fiteni et al. 2021). In a Galactic halo built through the accretion of numerous protogalactic fragments (e.g. Mackereth et al. 2019; Helmi 2020), it remains very plausible that most fast-moving halo stars are associated with past merger events in the MW.
We identified a second group of stars that do not approach the MW center and whose past orbits did not intersect the Galactic plane (b = 0°) during the past 1 Gyr. Unlike the previous subgroup, however, these stars are currently immersed in the Galactic disk (|z| ≤ 1 kpc). Although it is still possible that these stars originated far away from the disk, we cannot rule out completely that they were generated by other mechanisms within the MW plane. Seven of our targets fall in this category, but only three of them (HVS03, HVS08, and HVS10) are confirmed as HVSs. The remaining stars in this category are HiVel stars with Pesc ≤ 50% and vT ~ 500 km s-1, which are still remarkable velocities in the Galactic context.
The remaining stars in our sample have past orbits that intersect the Galactic plane, and three of them exhibit Pesc ≤ 50%. It is also likely that these HVSs that crossed the disk have an extragalactic origin, but the available data are insufficient to confirm this hypothesis.
While a precise chemical characterization of these targets is beyond the scope of this work, we derived approximate [Fe/H] estimates using the Doppler code. These values should be considered indicative only because the spectral resolution is limited and the sensitivity of the spectral templates in the metal-poor regime is reduced. Roughly speaking, the sample has a mean metallicity of «[Fe/H]» ~ -1.9, 13 stars have [Fe/H] ≤ -2, and 3 stars have [Fe/H] > -1. The group of stars classified as extragalactic exhibits very low metallicities that are clustered around [Fe/H] ~ -2.5. This value likely reflects the lower boundary of the applicability of the spectral template and not a physically meaningful estimate. Nevertheless, these stars constitute high-priority targets for follow-up high-resolution spectroscopy aimed at constraining their origins through chemical tagging. Interestingly, HVS07, our only target with a past trajectory that is marginally compatible with an origin near the Galactic center, also belongs to this extremely metal-poor group. This further argues against the classical Hills mechanism (binary disruption near the SMBH) as the dominant ejection process for this object.
On the other hand, the apparently most metal-rich star in the sample, HVS16, does not intersect the Galactic plane in its orbital history. Stars with these metallicities and velocities that exceed the local escape speed are promising candidates for an origin in MW satellites such as the LMC or the Sagittarius dwarf galaxy. Finally, stars that crossed the Galactic disk within the past 1 Gyr show a broader metallicity range. This suggests a diversity of stellar populations and possible origins.
Kinematic properties and classification of the analyzed HVS candidates.
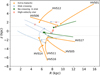 |
Fig. 4 Past orbits computed using GALPY (only the last 10 Myr are shown here), based on Gaia+FORS2 data. The solid orange, blue, and green lines represent different orbital classifications. Orange corresponds to targets with a hypothetical extragalactic origin, blue indicates orbits that crossed the Galactic plane (b = 0°), and green represents orbits of objects that are currently confined within the Galactic disk that did not cross the plane in the past. The dashed blue line corresponds to HVS07, the only HVS candidate that approaches the Galactic center. The gray squares indicate the position of the non-HVS sources. |
4.1 Other possible origins for the HVSs
Although a secure determination of the place of origin of these stars requires not only computing their orbits, but also incorporating additional information (e.g., chemical abundances), we proceeded by exploring some of the hypotheses proposed in the literature. In this section, we examine whether our candidates are spatially coincident with known systems within the MW or its immediate environment.
The center of the Galaxy is not the only place in which binary systems can interact with black holes. Less massive black holes, such as the elusive IMBHs, are theoretically capable of disrupting binary systems and generating HiVel stars or even HVSs (Fragione & Capuzzo-Dolcetta 2016; Fragione & Gualandris 2019). Evidence of the presence of IMBHs in Galactic globular clusters has been gathered during recent years, despite the observational effort required to unveil those objects in dense environments (e.g. Giesers et al. 2018). Recently, Häberle et al. (2024) found evidence of the existence of fast-moving stars with total velocities above the local vesc (cluster), although the number of these objects observed is too high to be explained through the binary-IMBH interaction mechanism alone. Nevertheless, different simulations have shown that this type of interaction in globular clusters could generate stars that travel at velocities as fast as ∼2000 km /s (Cabrera & Rodriguez 2023).
We investigated the potential ejection of HVSs from Galactic globular clusters by reconstructing their past orbits. This analysis used the potential model MWPotential2014, along with the Gaia DR3 astrometric data for the globular clusters (Baumgardt & Vasiliev 2021; Vasiliev & Baumgardt 2021). For this purpose, we computed 1000 orbital trajectories for the target stars and the globular clusters and analyzed the resulting minimum relative distance distributions. As a selection criterion, stars were considered potentially associated with a given cluster only if their mean past orbits approached within a minimum relative distance of 500 pc from the mean orbit of the cluster. Although the uncertainties in the astrometric parameters make these associations speculative, four stars satisfied the aforementioned criterion: HVS04, HVS07, HVS09, and HVS13. These stars approached NGC 6171, Terzan 6, IC 1276, and NGC 6121 at relative distances of d = 0.3±0.5 (10 Myr ago), 0.4± 0.4 (10 Myr), 0.4±0.7 kpc (5 Myr), and 0.1± 0.1 kpc (1 Myr), respectively. When we further restricted the minimum relative distance to dmin = 100 pc and computed the probability of having a relative distance below that threshold, however, we found that only HVS13 might be associated with NGC 6121 with Pcl = 36%. Consequently, these associations, although possible, cannot be confirmed given the current level of uncertainty.
The destruction of binary systems after a supernova detonation is also among the plausible scenarios of HVSs formation (see Ruiz-Lapuente et al. 2023, and references therein). In this case, the association of a HVS with a supernova remnant (SNR) is hindered by the difficulty to derive accurate distances and proper motions for the latter. In this case, we simply searched for HVSs whose past orbits intersected the current sky position of known SNRs from the catalog of Ferrand & Safi-Harb (2012)6. Only coincidences with a projected minimum distance of ≤10 arcmin during the past 5 Myr were considered. HVS09, HVS13, and HVS20 (all of them crossed the disk) might be associated with G018.0-00.7, G018.5-00.4, and G036.6+02.6, respectively. All these crossings took place between 2.5 and 3.9 Myr ago, but unfortunately, the mentioned SNRs are not completely characterized (e.g., distances). SNR lifetimes are about 106 yr under favorable environmental conditions (see Bamba & Williams 2022), which means that our longer hypothetical ejection times would discard these associations.
Satellite galaxies of the MW might host massive black holes (MBHs) that might generate mechanisms similar to the Hills mechanism. These processes would provide nearby stars with enough energy to escape from their host galaxies. For instance, Li et al. (2022) identified 60 HiVel stars that probably originated in the Sagittarius dwarf spheroidal galaxy, and at least 2 of them were classified as HVSs. The LMC is also a well-established generator of HVSs, and a few examples of HVSs with reconstructed orbits indicate its past position (e.g. Edelmann et al. 2005; Irrgang et al. 2018; Erkal et al. 2019), implying the presence of MBHs (see also Han et al. 2025). We repeated the same procedure as we followed for the globular clusters described above and assuming proper motions, distances, and vlos from the literature for the LMC (Pietrzyn´ ski et al. 2019; McConnachie 2012) and Sagittarius (Gaia Collaboration 2018b). None of the HVSs included in this work approached these systems close enough in the past to suggest an association: The closest encounter between the center of the LMC and one of our target stars have a minimum relative distance of d = 18 ± 25 kpc (HVS20) taking place ∼230 Myr ago. For Sagittarius, the star with closest past trajectory is also HVS20, with a minimum relative distance of d = 10 ± 3 kpc. The association of HVS20 (an RR-Lyrae variable) with the LMC is compatible within the current uncertainties. Because of its pulsating nature, the vlos of HVS20 is likely to be poorly constrained from a singleepoch spectrum, however. A dedicated spectroscopic follow-up covering multiple phases of its pulsation cycle is essential to constrain its systemic radial velocity better and test this intriguing association.
In conclusion, none of the HVS candidates included in this work presents past orbits that are clearly compatible with that of the MW satellites analyzed here or with the current position of known Galactic SNRs. Future Gaia data releases with more accurate astrometry and higher-precision velocities would allow us to better establish the probable crossing area through the Galactic plane, and reconstruct the past orbits of HVSs in comparison with those of other progenitor stellar systems.
4.2 Selecting a different Galactic potential
In the previous section, we showed that our ability to classify an object as an HVS and establish its place of origin is affected by the level of uncertainty in the Gaia astrometry. On the other hand, we exclusively relied on the MWPotential2014 (Bovy 2015), but it is important to assess the robustness of our classification under alternative Galactic potential models available in the literature.
For this purpose, we used AGAMA7, which allowed us to easily integrate orbits back in time with different gravitational potentials, either analytical or extracted from N-body simulations via basis function expansions (Vasiliev 2019). We considered the McMillan (2017) model of the Galactic gravitational potential and also a modified version, in which the potential of a bar with a total mass of 1010 M⊙ was added using the Pichardo et al. (2004) model with an angular velocity of Ωb = 35 km s-1 kpc-1 and without modifying the total mass of the system; the MilkyWayModel contained in GALA (Price-Whelan 2017) was also included in this analysis. In order to account for the reflex motion that the existence of a massive (1011 M⊙) satellite such as the LMC causes in the evolution of the Galactic potential over time (see discussion in Boubert et al. 2018; Vasiliev 2023), we also adopted two MW+LMC potentials: one potential that assumed a fixed mass for both systems (LMC-frozen), and a second potential with a varying density distribution over time (LMC-live).
We computed the past orbits for all the stars in our sample following the same procedure as described above and considering the different potentials. New minimum galactocentric distances were estimated for each of the potentials, as well as their Pesc (see Table 3). Regardless of the potential considered, the only star with an orbit consistent with r ≤ 1 kpc within uncertainties (i.e., possibly originated via the Hills mechanism) is HVS07 with rmin ∼ 1.2 kpc (the same value as obtained before). It is not surprising that these minimum distances are similar to the distance we obtained previously because these fast travelers are expected to be less strongly influenced by the MW mass distribution than other objects within the Galaxy in only a few million years.
The classification of our targets as HVSs and the resulting Pesc vary significantly depending on the choice of the MW potential model, however. Only two of our targets (three when the bar is included) have Pesc ≥ 50% when the McMillan (2017) model is implemented. In the Toomre diagram shown in Figure 3, most stars lie within the contour corresponding to 600 km s-1 in the (V,  ) plane. This value reflects the average vesc in the solar neighborhood based on that Galactic potential model. Figure 5 further illustrates the differences between Galaxy models, where vesc is displayed as a function of the MW potential model in the distance range 4.5 ≤ R [kpc] ≤ 10.0. A mean difference of ∼100 km s-1 between the vesc values predicted by MWPotential14 and the McMillan (2017) models is found across the whole distance range.
At an intermediate level, the prediction from the Price-Whelan (2017) model is almost identical to the value we obtained when we considered the LMC live and frozen models, allowing nine of our target stars to be classified as HVSs. Since the peculiar velocity of the Sun in the direction of the Galactic rotation is not particularly well constrained (variations of ∼10 km s-1), its contribution is relatively minor compared to the larger uncertainties in our total velocity estimates. The vT values in Figure 5 were therefore derived using the same solar motion parameters for simplicity, regardless of the Galactic potential we adopted.
These results show us that computing the past orbits of these HVS targets and establishing their origin is more affected by the uncertainties associated with the astrometric parameters and vlos than by the MW Galactic potential that is considered (we also refer the reader to the recent work by Armstrong et al. 2025). Whether a HiVel star is truly an HVS or not critically depends on the potential, however, and more specifically, on the MW dark halo mass (see discussion in Monari et al. 2018).
Minimum galactocentric distances and escape probabilities for the analyzed HVS candidates under different Galactic potential models.
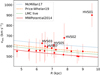 |
Fig. 5 vesc as a function of R for different Galactic potentials. The solid red line corresponds to the MWPotential2014 from GALPY, and the dashed lines located above correspond to the other potentials considered for our comparison. A maximum difference of ∼100 km s-1 is observed between the models along the full range in R included in this plot. The red points indicate the total velocities computed for the 23 HVS candidates. |
4.3 Prediction for the remaining HVS candidates
We have analyzed a small fraction of the HVS candidate stars and derived the only parameter that Gaia does not provide. This allowed us to compute VT and reconstruct their past orbits. We can extend our analysis to the remaining 132 candidate stars with Pesc,0 ≥ 50%, however based on their vt. Most of these stars (99) are part of the golden sample.
As shown in Figure 5, the McMillan (2017) MW potential predicts a Vesc higher than the values derived from the other potentials considered in the previous section. To provide a conservative estimate of the expected number of HVSs among the remaining stars, we adopted the Vesc estimate derived from this potential as a lower limit and identified the sources that satisfied vt ≥ vesc,MM. Figure 6 displays vesc,MM as a function of R, and vt of the remaining candidates without spectroscopic observations is overplotted.
Out of the sources without known vios, 93 have vt ≥ vesc,MM, making them potential HVS candidates. Only 13 of them were previously suggested in the literature as likely HVSs, and the resulting number of candidates therefore remains significant for this particular MW potential. The absence of measured vlos complicates a further analysis and classification based on the criteria used throughout this work, however. Follow-up spectroscopy will allow us to establish the nature of the remaining HVS candidates and confirm the suitability of blind-search methods based on DR3 or future Gaia data releases.
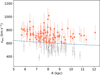 |
Fig. 6 vesc as a function of R for the McMillan (2017) MW potential (dashed blue line). The points indicate the vt computed for the remaining candidates, where orange and gray correspond to stars with vt ≥ vesc and vt < vesc, respectively. |
5 Conclusions
We estimated the probability that well-behaved Gaia DR3 sources without known vlos have vT > vesc. Among the sources with Pesc,0 ≥ 50%, we analyzed a subset of 23 HVS candidates by deriving the missing vlos component from FORS2 spectra and computing their past orbits. Our results indicate that the majority of observed candidates are unlikely to originate from the Galactic center. This challenges the assumption that HVSs are primarily ejected via interactions with the central SMBH through the so-called Hills mechanism. Instead, alternative mechanisms, such as satellite galaxy accretion, dynamical interactions in globular clusters, or supernova explosions in binary systems may play a significant role in their ejection.
Although we did not completely establish the origin of these HVSs, the past orbital trajectories of approximately one-third of the sample are consistent with an extragalactic origin. One of them, namely HVS01, is traveling through the MW at vT ~900 km s-1, which is remarkably high and supports the notion that its origin differs from more conventional acceleration mechanisms within the Galactic halo. Overall, their past orbits are not strongly dependent on the MW potential model considered. The uncertainties associated with the astrometry and the vlos values derived are therefore the main limiting factor when studying these potentially excellent tracers of the hierarchical formation of our Galaxy.
When we extended our analysis to the remaining 132 HVS candidates with an initial escape probability Pesc,0 > 50%, we identified 93 stars vt ≥ vesc in the Galactic potential with the largest vesc (most unfavorable for escaping stars). While this reinforces their potential as unbound stars, the absence of measured vlos remains a limiting factor in confirming their nature. Future spectroscopic follow-up, such as the follow-up that is currently being conducted by our team, combined with improved astrometry from upcoming Gaia data releases is essential to refine their classification and constrain the ejection mechanisms that shape the Galactic HVS population.
Acknowledgements
We thank the anonymous referee for a careful reading of the manuscript and for constructive comments that helped improve the quality and clarity of this work. We thank C. Mazzucchelli and M. Berton for coordinating the “all-weather” filler programs on which this work is based. We thank C. Mateu and K. Vivas for their useful comments on the impact that the variable nature of one of our targets could have in our results. J.A.C.-B. acknowledges support from FONDECYT Regular N 1220083. P.R. would like to thank all the participants of GalPhases24 for the helpful comments and fruitful discussions. F.G. gratefully acknowledges support from the French National Research Agency (ANR) funded project “MWDisc” (ANR-20-CE31-0004) and “Pristine” (ANR-18-CE31-0017). This work has made use of data from the European Space Agency (ESA) mission Gaia (https://www.cosmos.esa.int/gaia), processed by the Gaia Data Processing and Analysis Consortium (DPAC, https://www.cosmos.esa.int/web/gaia/dpac/consortium). Funding for the DPAC has been provided by national institutions, in particular the institutions participating in the Gaia Multilateral Agreement.
References
- Abadi, M. G., Navarro, J. F., & Steinmetz, M. 2009, ApJ, 691, L63 [Google Scholar]
- Armstrong, I., Evans, F. A., & Bovy, J. 2025, ApJ, 984, 56 [Google Scholar]
- Bailer-Jones, C. A. L., Rybizki, J., Fouesneau, M., Demleitner, M., & Andrae, R. 2021, AJ, 161, 147 [Google Scholar]
- Bamba, A., & Williams, B. J. 2022, in Handbook of X-ray and Gamma-ray Astrophysics, ed. C. Bambi & A. Sangangelo (Berlin: Springer), 77 [Google Scholar]
- Baumgardt, H., & Vasiliev, E. 2021, MNRAS, 505, 5957 [NASA ADS] [CrossRef] [Google Scholar]
- Baumgardt, H., Gualandris, A., & Zwart, S. P. 2006, MNRAS, 372, 174 [Google Scholar]
- Bland-Hawthorn, J., & Gerhard, O. 2016, ARA&A, 54, 529 [Google Scholar]
- Boubert, D., Guillochon, J., Hawkins, K., et al. 2018, MNRAS, 479, 2789 [Google Scholar]
- Bovy, J. 2015, ApJS, 216, 29 [NASA ADS] [CrossRef] [Google Scholar]
- Bovy, J., Allende Prieto, C., Beers, T. C., et al. 2012, ApJ, 759, 131 [NASA ADS] [CrossRef] [Google Scholar]
- Bromley, B. C., Kenyon, S. J., Geller, M. J., et al. 2006, ApJ, 653, 1194 [NASA ADS] [CrossRef] [Google Scholar]
- Brown, W. R. 2015, ARA&A, 53, 15 [Google Scholar]
- Brown, W. R., Geller, M. J., Kenyon, S. J., & Kurtz, M. J. 2005, ApJ, 622, L33 [Google Scholar]
- Brown, W. R., Geller, M. J., Kenyon, S. J., & Kurtz, M. J. 2006, ApJ, 640, L35 [NASA ADS] [CrossRef] [Google Scholar]
- Brown, W. R., Anderson, J., Gnedin, O. Y., et al. 2010, ApJ, 719, L23 [NASA ADS] [CrossRef] [Google Scholar]
- Brown, W. R., Geller, M. J., & Kenyon, S. J. 2014, ApJ, 787, 89 [Google Scholar]
- Burgasser, A. J., Gerasimov, R., Kremer, K., et al. 2024, ApJ, 971, L25 [NASA ADS] [CrossRef] [Google Scholar]
- Cabrera, T., & Rodriguez, C. L. 2023, ApJ, 953, 19 [Google Scholar]
- Capuzzo-Dolcetta, R., & Fragione, G. 2015, MNRAS, 454, 2677 [NASA ADS] [CrossRef] [Google Scholar]
- Chu, D. S., Do, T., Ghez, A., et al. 2023, ApJ, 948, 94 [NASA ADS] [CrossRef] [Google Scholar]
- Clementini, G., Ripepi, V., Garofalo, A., et al. 2023, A&A, 674, A18 [NASA ADS] [CrossRef] [EDP Sciences] [Google Scholar]
- Contigiani, O., Rossi, E. M., & Marchetti, T. 2019, MNRAS, 487, 4025 [NASA ADS] [CrossRef] [Google Scholar]
- Du, C., Li, H., Newberg, H. J., et al. 2018, ApJ, 869, L31 [NASA ADS] [CrossRef] [Google Scholar]
- Du, C., Li, H., Yan, Y., et al. 2019, ApJS, 244, 4 [Google Scholar]
- Edelmann, H., Napiwotzki, R., Heber, U., Christlieb, N., & Reimers, D. 2005, ApJ, 634, L181 [Google Scholar]
- Erkal, D., Boubert, D., Gualandris, A., Evans, N. W., & Antonini, F. 2019, MNRAS, 483, 2007 [NASA ADS] [CrossRef] [Google Scholar]
- Evans, F., Marchetti, T., & Rossi, E. 2022, MNRAS, 512, 2350 [NASA ADS] [CrossRef] [Google Scholar]
- Event Horizon Telescope Collaboration (Akiyama, K., et al.) 2022, ApJ, 930, L12 [NASA ADS] [CrossRef] [Google Scholar]
- Eyer, L., Audard, M., Holl, B., et al. 2023, A&A, 674, A13 [NASA ADS] [CrossRef] [EDP Sciences] [Google Scholar]
- Fang, Z., Li, X., & Li, H. 2025, ApJS, 277, 30 [Google Scholar]
- Ferrand, G., & Safi-Harb, S. 2012, AdSpR, 49, 1313 [Google Scholar]
- Fiteni, K., Caruana, J., Amarante, J. A. S., Debattista, V. P., & Beraldo e Silva, L. 2021, MNRAS, 503, 1418 [NASA ADS] [CrossRef] [Google Scholar]
- Fragione, G., & Capuzzo-Dolcetta, R. 2016, MNRAS, 458, 2596 [NASA ADS] [CrossRef] [Google Scholar]
- Fragione, G., & Gualandris, A. 2019, MNRAS, 489, 4543 [Google Scholar]
- Gaia Collaboration (Prusti, T., et al.) 2016, A&A, 595, A1 [NASA ADS] [CrossRef] [EDP Sciences] [Google Scholar]
- Gaia Collaboration (Brown, A. G. A., et al.) 2018a, A&A, 616, A1 [Google Scholar]
- Gaia Collaboration (Helmi, A., et al.) 2018b, A&A, 616, A12 [Google Scholar]
- Gaia Collaboration (Recio-Blanco, A., et al.) 2023a, A&A, 674, A38 [Google Scholar]
- Gaia Collaboration (Vallenari, A., et al.) 2023b, A&A, 674, A1 [Google Scholar]
- Gallo, A., Ostorero, L., Chakrabarty, S. S., Ebagezio, S., & Diaferio, A. 2022, A&A, 663, A72 [NASA ADS] [CrossRef] [EDP Sciences] [Google Scholar]
- Generozov, A. 2020, ApJ, 904, 118 [Google Scholar]
- Giesers, B., Dreizler, S., Husser, T.-O., et al. 2018, MNRAS, 475, L15 [NASA ADS] [CrossRef] [Google Scholar]
- Gualandris, A., & Zwart, S. P. 2007, MNRAS, 376, L29 [NASA ADS] [CrossRef] [Google Scholar]
- Gülzow, L., Fairbairn, M., & Schwarz, D. J. 2024, MNRAS, 529, 3816 [Google Scholar]
- Häberle, M., Neumayer, N., Seth, A., et al. 2024, Nature, 631, 285 [CrossRef] [Google Scholar]
- Han, J. J., El-Badry, K., Lucchini, S., et al. 2025, ApJ, 982, 188 [Google Scholar]
- Hattori, K., Taniguchi, D., Tsujimoto, T., et al. 2025, arXiv e-prints [arXiv:2502.20266] [Google Scholar]
- Hattori, K., Valluri, M., Bell, E. F., & Roederer, I. U. 2018, ApJ, 866, 121 [CrossRef] [Google Scholar]
- Helmi, A. 2020, ARA&A, 58, 205 [Google Scholar]
- Hills, J. G. 1988, Nature, 331, 687 [Google Scholar]
- Hirsch, H., Heber, U., O’Toole, S., & Bresolin, F. 2005, A&A, 444, L61 [NASA ADS] [CrossRef] [EDP Sciences] [Google Scholar]
- Huang, Y., Li, Q., Zhang, H., et al. 2021, ApJ, 907, L42 [NASA ADS] [CrossRef] [Google Scholar]
- Irrgang, A., Kreuzer, S., & Heber, U. 2018, A&A, 620, A48 [NASA ADS] [CrossRef] [EDP Sciences] [Google Scholar]
- Irrgang, A., Dimpel, M., Heber, U., & Raddi, R. 2021, A&A, 646, L4 [NASA ADS] [CrossRef] [EDP Sciences] [Google Scholar]
- Koposov, S. E., Boubert, D., Li, T. S., et al. 2020, MNRAS, 491, 2465 [Google Scholar]
- Koppelman, H. H., Helmi, A., Massari, D., Price-Whelan, A. M., & Starkenburg, T. K. 2019, A&A, 631, L9 [NASA ADS] [CrossRef] [EDP Sciences] [Google Scholar]
- Kreuzer, S., Irrgang, A., & Heber, U. 2020, A&A, 637, A53 [NASA ADS] [CrossRef] [EDP Sciences] [Google Scholar]
- Li, H., Tan, K., & Zhao, G. 2018, ApJS, 238, 16 [CrossRef] [Google Scholar]
- Li, Y.-B., Luo, A. L., Lu, Y.-J., et al. 2021, ApJS, 252, 3 [NASA ADS] [CrossRef] [Google Scholar]
- Li, H., Du, C., Ma, J., et al. 2022, ApJ, 933, L13 [CrossRef] [Google Scholar]
- Lian, J., Zasowski, G., Chen, B., et al. 2024, NatAs, 8, 1302 [Google Scholar]
- Liao, J., Du, C., Li, H., Ma, J., & Shi, J. 2023, ApJ, 944, L39 [NASA ADS] [CrossRef] [Google Scholar]
- Lin, Z., Xu, Y., Hao, C., et al. 2023, ApJ, 952, 64 [Google Scholar]
- Lindegren, L., Bastian, U., Biermann, M., et al. 2021a, A&A, 649, A4 [NASA ADS] [CrossRef] [EDP Sciences] [Google Scholar]
- Lindegren, L., Klioner, S. A., Hernández, J., et al. 2021b, A&A, 649, A2 [NASA ADS] [CrossRef] [EDP Sciences] [Google Scholar]
- Mackereth, J. T., Schiavon, R. P., Pfeffer, J., et al. 2019, MNRAS, 482, 3426 [Google Scholar]
- Marchetti, T., Rossi, E., Kordopatis, G., et al. 2017, MNRAS, 470, 1388 [NASA ADS] [CrossRef] [Google Scholar]
- Marchetti, T., Contigiani, O., Rossi, E., et al. 2018, MNRAS, 476, 4697 [NASA ADS] [CrossRef] [Google Scholar]
- Marchetti, T., Rossi, E., & Brown, A. 2019, MNRAS, 490, 157 [Google Scholar]
- Marchetti, T., Evans, F. A., & Rossi, E. M. 2022, MNRAS, 515, 767 [CrossRef] [Google Scholar]
- Matsuno, T., Aoki, W., & Suda, T. 2019, ApJ, 874, L35 [NASA ADS] [CrossRef] [Google Scholar]
- McConnachie, A. W. 2012, AJ, 144, 4 [Google Scholar]
- McMillan, P. J. 2017, MNRAS, 465, 76 [NASA ADS] [CrossRef] [Google Scholar]
- Monari, G., Famaey, B., Carrillo, I., et al. 2018, A&A, 616, L9 [NASA ADS] [CrossRef] [EDP Sciences] [Google Scholar]
- Montanari, F., Barrado, D., & García-Bellido, J. 2019, MNRAS, 490, 5647 [Google Scholar]
- Myeong, G. C., Vasiliev, E., Iorio, G., Evans, N. W., & Belokurov, V. 2019, MNRAS, 488, 1235 [Google Scholar]
- Palladino, L. E., Schlesinger, K. J., Holley-Bockelmann, K., et al. 2014, ApJ, 780, 7 [Google Scholar]
- Pichardo, B., Martos, M., & Moreno, E. 2004, ApJ, 609, 144 [NASA ADS] [CrossRef] [Google Scholar]
- Pietrzyn´ ski, G., Graczyk, D., Gallenne, A., et al. 2019, Nature, 567, 200 [NASA ADS] [CrossRef] [Google Scholar]
- Piffl, T., Williams, M., & Steinmetz, M. 2011, A&A, 535, A70 [NASA ADS] [CrossRef] [EDP Sciences] [Google Scholar]
- Placco, V. M., Frebel, A., Beers, T. C., & Stancliffe, R. J. 2014, ApJ, 797, 21 [Google Scholar]
- Price-Whelan, A. M. 2017, JOSS, 2, 388 [Google Scholar]
- Prudil, Z., Smolec, R., Kunder, A., Koch-Hansen, A. J., & Dékány, I. 2024, A&A, 685, A153 [NASA ADS] [CrossRef] [EDP Sciences] [Google Scholar]
- Quispe-Huaynasi, F., Roig, F., McDonald, D. J., et al. 2022, AJ, 164, 187 [NASA ADS] [CrossRef] [Google Scholar]
- Ruiz-Lapuente, P., Hern´ andez, J. G., Cartier, R., et al. 2023, ApJ, 947, 90 [Google Scholar]
- Rybizki, J., Green, G. M., Rix, H.-W., et al. 2022, MNRAS, 510, 2597 [NASA ADS] [CrossRef] [Google Scholar]
- Scholz, R. D. 2024, A&A, 685, A162 [NASA ADS] [CrossRef] [EDP Sciences] [Google Scholar]
- Schönrich, R., Binney, J., & Dehnen, W. 2010, MNRAS, 403, 1829 [NASA ADS] [CrossRef] [Google Scholar]
- Silva, M., & Napiwotzki, R. 2011, MNRAS, 411, 2596 [Google Scholar]
- Starkenburg, E., Shetrone, M. D., McConnachie, A. W., & Venn, K. A. 2014, MNRAS, 441, 1217 [Google Scholar]
- Tillich, A., Przybilla, N., Scholz, R. D., & Heber, U. 2009, A&A, 507, L37 [NASA ADS] [CrossRef] [EDP Sciences] [Google Scholar]
- Vasiliev, E. 2019, MNRAS, 482, 1525 [Google Scholar]
- Vasiliev, E. 2023, Galaxies, 11, 59 [NASA ADS] [CrossRef] [Google Scholar]
- Vasiliev, E., & Baumgardt, H. 2021, MNRAS, 505, 5978 [NASA ADS] [CrossRef] [Google Scholar]
- Verberne, S., Rossi, E. M., Koposov, S. E., et al. 2024, MNRAS, 533, 2747 [NASA ADS] [CrossRef] [Google Scholar]
- Wehrhahn, A., Piskunov, N., & Ryabchikova, T. 2023, A&A, 671, A171 [NASA ADS] [CrossRef] [EDP Sciences] [Google Scholar]
- Yu, Q., & Tremaine, S. 2003, ApJ, 599, 1129 [Google Scholar]

At the time of the first observing run, we had assumed vlos0 = 0 km s-1 for all the stars, regardless of their position within the Galaxy.
All Tables
Minimum galactocentric distances and escape probabilities for the analyzed HVS candidates under different Galactic potential models.
All Figures
|
Fig. 1 vT distribution from 1000 realizations for two HVS candidates with similar median vesc (~500 km s-1; vertical blue line). The yellow and orange distributions are associated with stars with initial escape probabilities of Pesc,0 = 10 and 75%, respectively. |
| In the text | |
|
Fig. 2 Spatial distribution of the HVS candidates in the ℓ - b and Y - X planes are shown in the left and central panels, respectively. Objects for which we obtained follow-up spectroscopy are marked with red squares. Right: position of the HVS candidates and targets observed in the color-magnitude diagram (absolute magnitudes). |
| In the text | |
|
Fig. 3 Toomre diagram showing the kinematic distribution of our stars in the (V, |
| In the text | |
|
Fig. 4 Past orbits computed using GALPY (only the last 10 Myr are shown here), based on Gaia+FORS2 data. The solid orange, blue, and green lines represent different orbital classifications. Orange corresponds to targets with a hypothetical extragalactic origin, blue indicates orbits that crossed the Galactic plane (b = 0°), and green represents orbits of objects that are currently confined within the Galactic disk that did not cross the plane in the past. The dashed blue line corresponds to HVS07, the only HVS candidate that approaches the Galactic center. The gray squares indicate the position of the non-HVS sources. |
| In the text | |
|
Fig. 5 vesc as a function of R for different Galactic potentials. The solid red line corresponds to the MWPotential2014 from GALPY, and the dashed lines located above correspond to the other potentials considered for our comparison. A maximum difference of ∼100 km s-1 is observed between the models along the full range in R included in this plot. The red points indicate the total velocities computed for the 23 HVS candidates. |
| In the text | |
|
Fig. 6 vesc as a function of R for the McMillan (2017) MW potential (dashed blue line). The points indicate the vt computed for the remaining candidates, where orange and gray correspond to stars with vt ≥ vesc and vt < vesc, respectively. |
| In the text | |
Current usage metrics show cumulative count of Article Views (full-text article views including HTML views, PDF and ePub downloads, according to the available data) and Abstracts Views on Vision4Press platform.
Data correspond to usage on the plateform after 2015. The current usage metrics is available 48-96 hours after online publication and is updated daily on week days.
Initial download of the metrics may take a while.