Fig. 5
Download original image
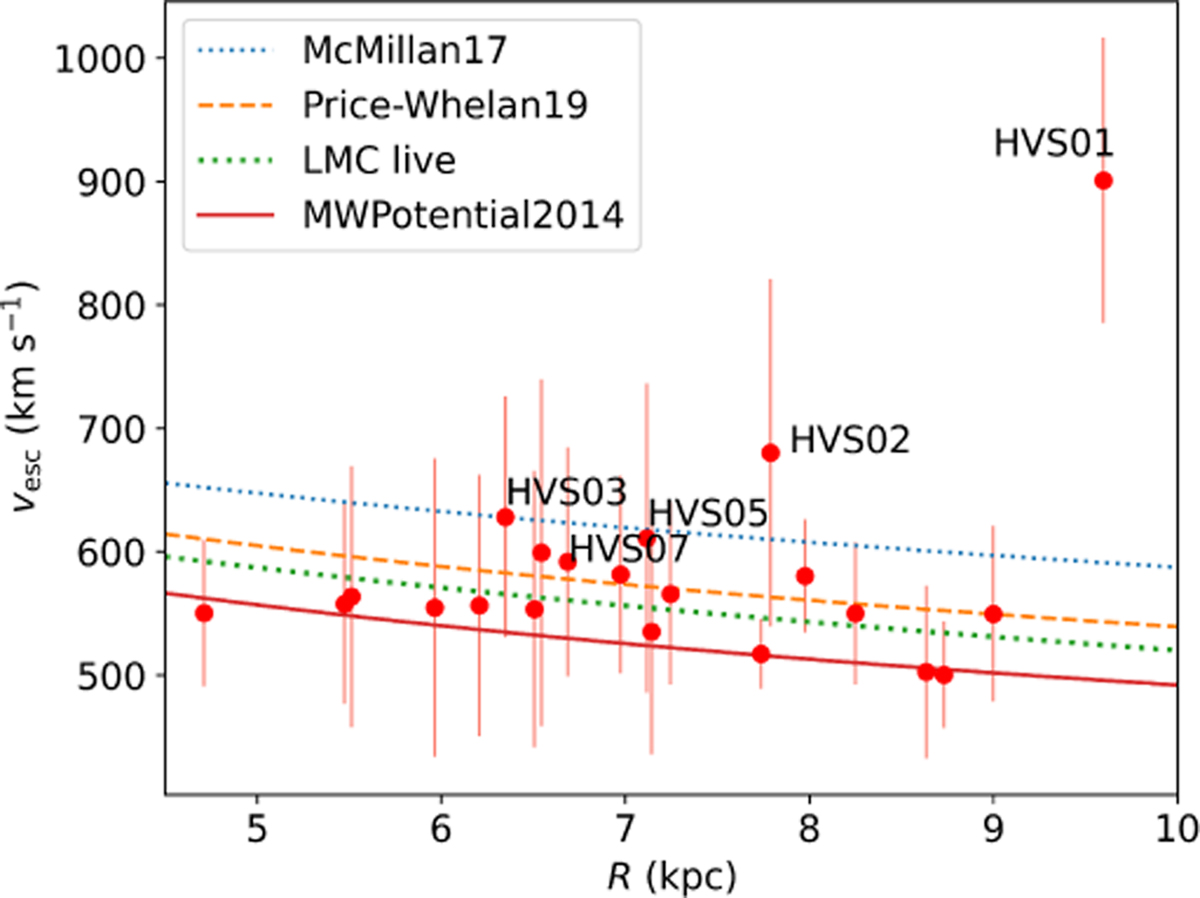
vesc as a function of R for different Galactic potentials. The solid red line corresponds to the MWPotential2014 from GALPY, and the dashed lines located above correspond to the other potentials considered for our comparison. A maximum difference of ∼100 km s-1 is observed between the models along the full range in R included in this plot. The red points indicate the total velocities computed for the 23 HVS candidates.
Current usage metrics show cumulative count of Article Views (full-text article views including HTML views, PDF and ePub downloads, according to the available data) and Abstracts Views on Vision4Press platform.
Data correspond to usage on the plateform after 2015. The current usage metrics is available 48-96 hours after online publication and is updated daily on week days.
Initial download of the metrics may take a while.