Open Access
Fig. 6
Download original image
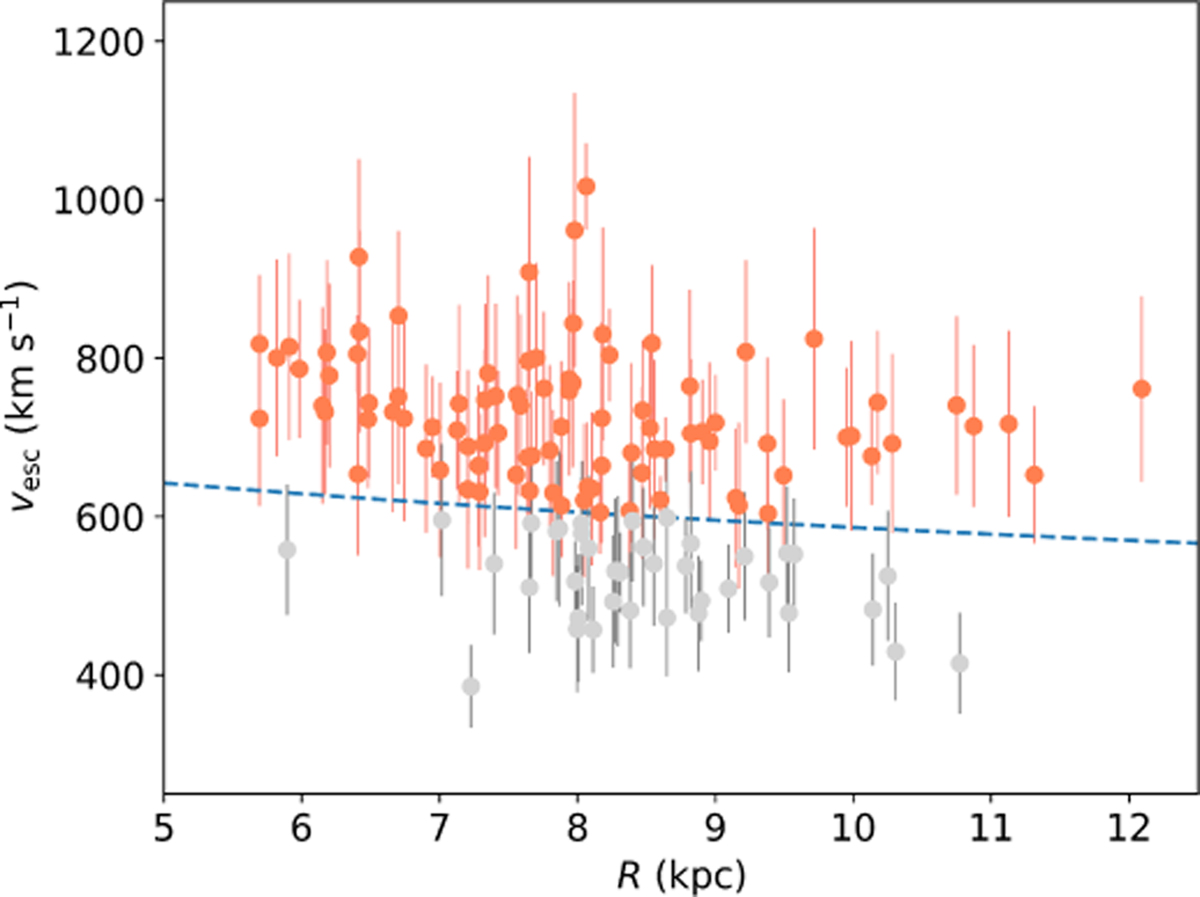
vesc as a function of R for the McMillan (2017) MW potential (dashed blue line). The points indicate the vt computed for the remaining candidates, where orange and gray correspond to stars with vt ≥ vesc and vt < vesc, respectively.
Current usage metrics show cumulative count of Article Views (full-text article views including HTML views, PDF and ePub downloads, according to the available data) and Abstracts Views on Vision4Press platform.
Data correspond to usage on the plateform after 2015. The current usage metrics is available 48-96 hours after online publication and is updated daily on week days.
Initial download of the metrics may take a while.