Fig. 10
Download original image
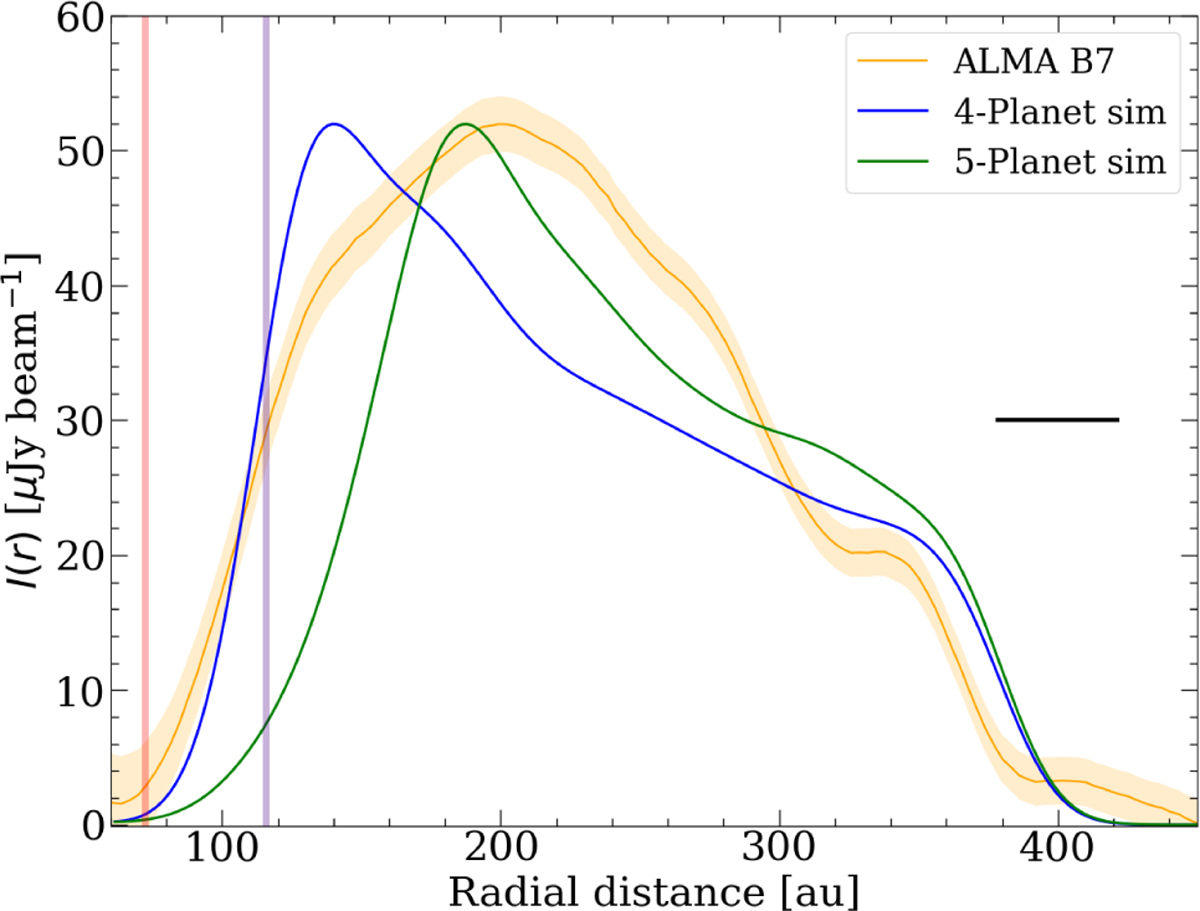
Radial intensity for the ALMA observation (orange line) along with our two relative intensity profiles for the four- and five-planet simulation in blue and green, respectively. The relative intensity of the simulation was calculated assuming that the planetesimals emit as blackbodies, following the relation I(r) ∝ Σ(r)r–1/2. The intensity was smoothed using a Gaussian filter of 43 au. The beam size is shown as the black line. The locations of Planet b (red) and Planet x (violet) are marked by vertical lines for reference.
Current usage metrics show cumulative count of Article Views (full-text article views including HTML views, PDF and ePub downloads, according to the available data) and Abstracts Views on Vision4Press platform.
Data correspond to usage on the plateform after 2015. The current usage metrics is available 48-96 hours after online publication and is updated daily on week days.
Initial download of the metrics may take a while.