| Issue |
A&A
Volume 700, August 2025
|
|
|---|---|---|
| Article Number | A148 | |
| Number of page(s) | 15 | |
| Section | Planets, planetary systems, and small bodies | |
| DOI | https://doi.org/10.1051/0004-6361/202554802 | |
| Published online | 14 August 2025 | |
The HR 8799 debris disk: Shaped by planetary migration and a possible fifth outermost planet
1
Univ. Grenoble Alpes, CNRS, IPAG,
38000
Grenoble,
France
2
Department of Physics, University of Warwick,
Coventry
CV4 7AL,
UK
3
Instituto de Astrofísica, Pontificia Universidad Catόlica de Chile, Av. Vicuña Mackenna 4860,
782-0436
Macul,
Santiago,
Chile
★ Corresponding author: This email address is being protected from spambots. You need JavaScript enabled to view it.
Received:
27
March
2025
Accepted:
2
July
2025
Abstract
Context. The HR 8799 system hosts four giant planets between a warm and cold debris disk and has an extended dusty tail beyond. It serves as an ideal laboratory for studying planetary formation and evolution. The debris disks have been observed at various wavelengths, and the planetary properties are well constrained. Nonetheless, there are still open questions regarding the role of the planets in shaping the debris disks.
Aims. We investigated the system evolution with the aim of understanding how planetary migration shaped its architecture in terms of planets and the disk.
Methods. We performed N-body simulations to model the HR 8799 system. We examined the orbital evolution of the known four super-Jupiter planets through the course of simple, imposed migration in a gaseous disk as they perturb an external massless planetesimal disk. We also explored the impact of introducing a fifth planet on the dynamical and morphological aspects of the disk.
Results. The planets migrate outward as a result of their imposed interactions with the gaseous disk while maintaining their resonant configuration. This outward migration excites the planetesimal disk and produces a transient scattered population. While a four-planet system partially reproduces the observed cavity between the star and the cold debris disk, the inclusion of a fifth low-mass planet appears to be crucial for better reproducing key morphological aspects of the cold debris disk.
Conclusions. This model provides a novel explanation for the architecture of HR 8799. Outward planetary migration, combined with mean-motion resonant interactions and a fifth low-mass planet, can effectively replicate the observed planetary architecture and the characteristics of the cold debris disk. Our findings underscore the potential important role of planetary migration in shaping debris disks.
Key words: methods: analytical / methods: numerical / planets and satellites: dynamical evolution and stability / protoplanetary disks / planet-disk interactions / stars: individual: HR 8799
© The Authors 2025
 Open Access article, published by EDP Sciences, under the terms of the Creative Commons Attribution License (https://creativecommons.org/licenses/by/4.0), which permits unrestricted use, distribution, and reproduction in any medium, provided the original work is properly cited.
This article is published in open access under the Subscribe to Open model. This email address is being protected from spambots. You need JavaScript enabled to view it. to support open access publication.
1 Introduction
The architecture of a planetary system emerges from the complex interplay of various processes that shape its final architecture. This begins with the formation of a protoplanetary disk (PPD) around a central star, in which dust particles coagulate into planetesimals (see Armitage 2018, for a comprehensive review). In this environment, protoplanets emerge and perturb their surroundings in the process. Protoplanets acquire most of their properties from the PPD, such as mass and chemical composition; their final positions are also influenced by interactions with other protoplanets and the gaseous disk, however, in particular, during the final stages of formation. It is crucial to understand this stage to reconstruct the evolutionary paths of planets from their formation to their currently observed positions.
The most extensively studied planetary system is, without a doubt, our Solar System. The abundance of available data provides strong constraints on models aiming to explain its architecture, particularly concerning planetary orbital parameters, and the characteristics of the asteroid and Kuiper belts. One prominent model for the Solar System evolution is the Nice model, which describes the current planetary locations while also reproducing planetesimal populations in the Kuiper belt (Gomes et al. 2005; Tsiganis et al. 2005; Morbidelli et al. 2005; Levison et al. 2008; Nesvorný & Morbidelli 2012). This early instability is thought to arise from a combination of the inward and outward migration of the planets that might have occurred while gas was still present in the solar protoplanetary disk (Griveaud et al. 2024). Thus, the Nice model offers a consistent and plausible evolutionary path for the Solar System. The natural question then arises as to whether other planetary systems might have undergone similar evolutionary processes.
The search for and characterization of exoplanets is a highly active field. Since the first discovery of an exoplanet orbiting a main-sequence star 51 Pegasi b (Mayor & Queloz 1995), the catalog of exoplanets has grown substantially. Detection capabilities were significantly enhanced with the Kepler mission (Borucki et al. 2010) and later with the Transiting Exoplanet Survey Satellite (TESS) mission (Ricker et al. 2015). Currently, there are approximately 7000 confirmed exoplanets, with about 1000 in multiplanet systems1. These multiplanet systems provide a unique opportunity to study the evolution of planetary architectures. In this context, the HR 8799 system stands out as a prime candidate for these studies. Its unique combination of four giant planets with well-characterized orbits and the well-studied debris disks makes it an ideal candidate for probing the dynamical evolution of an extrasolar system.
We explore a novel planetary evolutionary scenario that deviates from classical migration models. Specifically, we investigate the orbital evolution of super-Jupiter planets undergoing outward- and inward-migration phases. We perform a parametric analysis to explore evolutionary pathways that could lead to the current observed architecture of the HR 8799 system. To do this, we focus on the semimajor axes, eccentricities, and resonant angles of the planets, along with the planetesimal distribution within the debris disk. The remainder of the paper is organized as follows: Section 2 provides a summary of the properties, observations, and previous models of the HR 8799 system; Section 3 details the numerical techniques and the migration prescriptions; and Section 4 presents the main results, which are further discussed in Section 5. Finally, conclusions are drawn in Section 6.
2 The HR 8799 system
The HR 8799 (HD 218396) system is an exemplary case of exoplanets detected through direct imaging. It has been extensively studied and is often used as a model laboratory for planetary formation theories. The system is located approximately 41 parsecs away (Gaia Collaboration 2021) and consists of a central star, four directly imaged planets, and multiple debris populations, including a well-characterized debris disk exterior to the known planets. We describe the system in detail below.
2.1 Architecture
The central star, with a dymamical mass of  M⊙ Baines et al. (2012), is classified as F0V/kA5mA5 (Gray et al. 2003). It is a variable star of the γ Doradus type (Zerbi et al. 1999; Kaye et al. 1999) and is identified as a λ Boötis star due to its unique chemical abundance (Gray & Kaye 1999; Sadakane 2006; Moya et al. 2010b). Its age, however, is uncertain, with values ranging from 25–60 Myr (Zuckerman & Song 2012; Rhee et al. 2007; Bell et al. 2015) to as much as 1 Gyr (Moya et al. 2010a), although the consensus generally lies within the range of 30–40 Myr.
Four super-Jupiter-mass planets orbit the host star, which were detected through direct imaging (Marois et al. 2008, 2010). From innermost to outermost, these planets are designated as Planet e, d, c, and b, with estimated deprojected separations of approximately 16, 27, 41, and 72 au, respectively, based on a combination of astrometric and dynamical models. In terms of mass, the innermost three planets are estimated to range from 7 to 10 Mjup, with Planet d being the most massive, while the outermost planet has a mass of about 6 Mjup or less. However, the exact values depend on the model employed. Due to their substantial mass and close mutual separations, studies suggest that these planets are in a mean-motion resonance (MMR) chain of 8:4:2:1 to maintain system stability (Fabrycky & Murray-Clay 2010; Esposito et al. 2013; Konopacky et al. 2016; Zurlo et al. 2016; Wang et al. 2018; Goździewski & Migaszewski 2018; GRAVITY Collaboration 2019; Goździewski & Migaszewski 2020; Brandt et al. 2021; Zurlo et al. 2022; Thompson et al. 2023). The presence of planets in MMRs implies a potential history of convergent migration to reach their current positions (Goldreich & Tremaine 1980; Goldreich & Schlichting 2014). Notably, only about 0.6% of 0.1–3 M⊙ stars host planets within the 5–13 Mjup range at orbital distances of 30–300 au (Bowler 2016), making this architecture quite rare in the current context of exoplanets. The planets’ atmospheres have also been characterized, revealing an unexpectedly high metallicity for all the planets (Nasedkin et al. 2024; Balmer et al. 2025).
Finally, the system hosts a debris disk that was first detected by IRAS (Sadakane 2006) and was initially spatially resolved using SPITZER (Su et al. 2009). The disk comprises three components: an inner warm debris disk (≲ 15 au), an outer cold debris disk (≳ 100 au), and a millimeter-tail extending beyond the outer disk (≳ 300 au), potentially indicating a scattered disk. The disk has been characterized in the infrared and (sub-)millimeter wavelengths (Hughes et al. 2011; Matthews et al. 2014; Booth et al. 2016; Faramaz et al. 2021; Boccaletti et al. 2024).
All these features suggest a parallel with our Solar System, but on a larger scale: an inner asteroid belt analog, with four exterior giant planets, and a Kuiper belt analog beyond them. Due to these similarities with the Solar System, numerous models have been proposed to explain the formation and evolution of the HR 8799 system. Although many of these models have successfully explained certain aspects of the system, none has comprehensively accounted for all the observed features, as we diskuss below.
2.2 Discrepancies between observations and existing models
The primary goals of existing models for HR 8799 are twofold: (i) to explain the planetary MMR chain, and (ii) to reproduce the structure of the debris disk, including the separation between the outermost planetary orbit and the inner edge of the outer debris disk. Although the first point is addressed by an important number of works (see Section 2.1 for references), the second point remains elusive.
Initial observations reported the outer disk inner edge to be 100±10 au (Su et al. 2009; Matthews et al. 2014), consistent with the location of Planet b maintaining the edge, as predicted by the criterion of overlapping first order MMRs (Wisdom 1980). Subsequent observations with higher angular resolution with ALMA at 1.3 mm (Booth et al. 2016) found larger radius for the inner edge, namely, ≈145 au2. Wang et al. (2018) calculated an inner edge of  au based on observational constraints related to the orbit of Planet b, however. The inner edge at about 145 au was later corroborated by ALMA Band 7 observations (Faramaz et al. 2021). Consequently, a new planet was proposed to explain and shape the disk, with N-body simulations suggesting a semimajor axis of approximately 100–120 au to maintain the edge (Read et al. 2018; Goździewski & Migaszewski 2018; Pearce et al. 2022). Additionally, Imaz Blanco et al. (2023) found the inner edge to have a shallow surface-density profile, which is potentially consistent with collisional evolution rather than sculpting by a (hypothetical) nonmigrating planet (see also Pearce et al. (2024)). This does not rule out sculpting by a migrating planet, however.
The dynamical stability of this hypothetical fifth planet was examined by Goździewski & Migaszewski (2018), who found that a planet with a mass of up to 3 Mjup could remain stable in an MMR with the other planets. Observational constraints limit the maximum mass of such a planet to 1 Mjup (Maire et al. 2015; Zurlo et al. 2022), however. Alternatively, Read et al. (2018) proposed reducing the mass of the fifth planet to as low as 0.04 Mjup (13 Μ⊕) to achieve a strong alignment with observational data. Nevertheless, there is currently no evidence of this fifth planet in JWST/MIRI observations (Boccaletti et al. 2024).
Finally, a notable characteristic of the disk is the possible presence of two distinct populations of bodies. Geiler et al. (2019) used a collisional model to demonstrate that Herschel and ALMA data are incompatible without including an eccentric population. Similar to the Kuiper Belt, it seems that there is a cold population, characterized by low eccentricities and low orbital inclinations (i.e., e ~ 0.05 and I < 5°), and a hot or scattered population, composed of objects that would exhibit a wide range of eccentricities and/or orbital inclinations. A potential explanation for the hot population is provided by Goździewski & Migaszewski (2018, 2020), who suggest that either a fifth planet is inducing resonant clumps or, alternatively, that the inward migration of Planet b excited bodies in the disk, which initially had an inner edge located at 150 au.
At this stage, it is evident that despite our extensive knowledge of the HR 8799 system and the numerous models put forward, these efforts are insufficient to fully explain its architecture—specifically, the cavity size, the shape of the inner edge, and the possible presence of scattered population. This highlights the need for reevaluating the mechanisms governing the formation and evolution of this system. This work investigates and explores an alternative scenario to the typical convergent migration pathway, specifically focusing on how the super-Jupiters may have undergone outward migration, which may shape the radial profile of the debris disk while maintaining the planetary orbits in an interlinked MMR. We aim to enhance our understanding of the HR 8799 system by examining various configurations and migration scenarios.
3 Methods
We conducted N-body simulations using REBOUND and its extension package, REBOUNDX (Rein & Liu 2012; Tamayo et al. 2020), considering an HR 8799-like system consisting of a central star with mass 1.52 Μ⊙, the four observed planets with masses from the inside out ({8.0, 9.5, 7.5, 6.0} Mjup) and an outer debris disk composed of massless particles. The case with a potential fifth planet is presented in Section 4.4.
We self-consistently considered the evolution of planets and a broad debris disk from the PPD phase, accounting for the gas effects as a migration trigger on planets. We assume the planets are formed and initially in a resonant configuration, on orbits closer to the star than currently observed (see Table 1). The initial condition of the MMR chain enables the radial movement of all planets to be affected by changes in the movement of just one of them. We imposed migration prescriptions for the planets along with a gas disk dissipation prescription, and we calculated the necessary migration timescales that the planets embedded in the PPD could have.
Our aim is to explore a simple scenario, where we artificially imposed migration and examined its effect on the planet and debris architecture. We emphasize that our model does not address the underlying causes or origins of migration. Rather, we aim to show that if some PPD mechanism(s) could drive outward and inward migration, then this could reproduce the observed system.
Migration is a phenomenon that can be viewed as a competition between the local disk features and planetary mass; therefore, the amplitude and, importantly, the direction of migration will differ for different kinds of planets and disks. Consequently, we incorporated a prescription that can induce both inward and outward migration. A detailed description of the model, along with relevant justifications, is provided below.
Summary of parameters used to build up the fiducial simulation.
3.1 Prescription of the planet migration
Planetary migration can arise from interactions between planets and a gaseous disk (Lin & Papaloizou 1979; Goldreich & Tremaine 1979). disk torques facilitate the transfer of energy and angular momentum, typically leading to inward migration. While simulations generally support this mechanism (e.g. Snellgrove et al. 2001; Nelson & Papaloizou 2002), the process depends on disk parameters, such as viscosity and density. An important consequence of the migration process is the capture of the consecutive planets in MMR.
N-body simulations can incorporate the migration effect as an imposed nonconservative force, as proposed by e.g. Beaugé et al. (2006). For planet i, this force, per unit mass, can be written as
 (1)
(1)
where the subindexes i represent different planets in the system, and fa (τa,i) and fe (τe,i) the components related to the orbital decay and the circularization of the orbit, respectively. The parameters τa,i and τe,i are the radial and eccentricity damping timescales, respectively, which can be related via τe,i = τa,i / κ (Lee & Peale 2002). We adopt κ = 100 for our simulations. By expanding the components of the force, we obtain:
 (2)
(2)
![Mathematical equation: ${f_e} = - {{2\kappa } \over {3{\tau _{a,i}}}}\left[ {{1 \over {1 - e_i^2}}{\upsilon _i} - {{{\mu _i}} \over {\left| {{h_i}} \right|}}\left( {{{\hat h}_i} \times {{\hat r}_i}} \right)} \right],$](/articles/aa/full_html/2025/08/aa54802-25/aa54802-25-eq11.png) (3)
(3)
with υi the velocity, hi the specific angular momentum, ri the position, ei the eccentricity, and μi = G(M + mi) with G the gravitational constant, mi the mass of the planet i, and M is the mass enclosed by the planet.
Equations (2) and (3) would lead to a continuous migration and eccentricity damping. To overcome this, we numerically implement an exponential growth for the migration timescale (Goździewski & Migaszewski 2018), which is equivalent to an exponential decay in the force, such that:
 (4)
(4)
where Td is the gas-disk-dispersal timescale or disk lifetime (Mamajek 2009). Inherent to Equation (4) is the assumption that the gas disk disperses uniformly over time. Then, different planets with different migration timescales will have the same exponential variation. The value of Td is observationally estimated to be between 1 and 10 Myr with a median value of 2–3 Myr (Haisch et al. 2001; Williams & Cieza 2011). We explore the values 1, 2.75, and 6 Myr to cover from short to long disk lifetimes.
Recent studies have challenged the traditional inward-migration paradigm associated with classical migration theory. These findings suggest that outward migration may be a viable scenario under certain conditions. To model outward migration, we employ a modified version of Equations (2) and (3) (Hahn & Malhotra 2005; Ali-Dib et al. 2021). To distinguish the parameters for outward migration from those of inward migration, we adopted a plus as superscript. Consequently, the forms of Equations (2) and (3) change to
 (5)
(5)
 (6)
(6)
It is important to note that the change in sign in fa will lead to exponential growth in the semimajor axis. To prevent this, the second term in Equation (5) restricts the growth of the semimajor axis ai until it reaches a specific value, alim, starting from an initial value, ainit (where ainit < alim). This upper limit is unlikely to be attained due to the influence of the exponential term, however, which introduces exponential decay in the force. Additionally, we assume an eccentricity damping mechanism similar to that of the inward-migration prescription, as described in Equation (3), but also incorporating exponential decay of the force. The term  defines the duration during which outward migration affects the planets, and we assume it to be a fraction of Td. Consequently, we consider that outward migration concludes before inward migration ceases. This assumption is justified in Section 3.2, where we discuss the mechanisms that may trigger outward migration.
3.2 Planet migration regimes
The typical inward-migration regimes are called type-I and type-II. Type-I migration affects low-mass planets that are unable to carve a gap around their orbits, while type-II migration applies to planets capable of opening a gap (Papaloizou & Terquem 2006; Nelson 2018; Armitage 2018). Given the planetary masses in HR 8799, type-II migration is of interest. Kanagawa et al. (2018) estimated the inward-migration timescale as follows:
 (7)
(7)
where the planet-related parameters q = mp/Mstar, rp, and Ωp are the planet-to-star mass ratio, the orbital radius of the planet, and angular velocity, respectively. Additionally, h is the aspect ratio of the disk, and Σgap is the surface density of the gap, which is given by
 (8)
(8)
where Σdd represents the gas surface density in a disk-dominated case, in other words, it refers to the gas surface density that the disk would have in the absence of any perturbing planets, K is the gap depth, α is the Shakura–Sunyaev viscosity (Shakura & Sunyaev 1973), and β is a constant, which can be 0.034 or 0.040 according to Duffell & MacFadyen (2013) or Kanagawa et al. (2015), respectively. We use β = 0.034 for our calculations.
On the other hand, outward migration can be reached in scenarios such as:
- (i)
A Jupiter-like planet can migrate outward if the initial disk exhibits a steeply falling surface density profile (Chen et al. 2020),
- (ii)
A planet can migrate if it is trapped at the edge of a gaseous disk when the inner rim of the disk moves outward due to photoevaporation (Liu et al. 2017, 2022),
- (iii)
A planet on an eccentric orbit can migrate outward when its eccentricity is ≥0.2 (D’Angelo et al. 2006),
- (iv)
An eccentric gap (≳0.1) created by a super Jupiter-mass planet can drive the planet itself to migrate outward (Dempsey et al. 2021; Scardoni et al. 2022).
The first two mechanisms encounter challenges when explaining the outward migration of planets more massive than Jupiter, as is the case in HR 8799. Furthermore, the second mechanism is only efficient for planets that are close to the star, making both unsuitable for application to the planets in HR 8799. In contrast, the third and fourth mechanisms are effective for supermassive planets and do not face these limitations. An initially highly eccentric planet is rapidly circularized due to the influence of the PPD (Bitsch et al. 2013), however, which makes the third scenario unlikely. Although the fourth mechanism seems promising, it is important to note that all the mechanisms discussed so far consider the outward migration of a single planet. Introducing additional planets could alter the net torque on the system, potentially changing its magnitude or even the direction of migration. They could also affect the gap profiles, or merge gaps together. Nonetheless, we use the fourth mechanism as a reasonable basis for our hypothetical migration prescription, noting again that we are less concerned with the physical origins of migration and more with its potential impact on the system architecture.
According to the fourth mechanism, when a single planet possesses sufficient mass (≥3 Mjup), it can carve out an eccentric cavity, which increases its accretion rate and generates a positive torque over the planet (Kley & Dirksen 2006; Fung et al. 2014; Tanaka et al. 2022). This torque induces outward planetary migration, with an associated timescale given by:
 (9)
(9)
where  is the normalized torque such that
 ![Mathematical equation: $\tilde \Gamma \in (0,\,1]$](/articles/aa/full_html/2025/08/aa54802-25/aa54802-25-eq20.png) according to numerical simulations (Dempsey et al. 2021; Scardoni et al. 2022) to ensure an outward migration. This value may change with the addition of extra planets in their calculations.. The increase in the accretion rate, approximately an order of magnitude greater than that of a noneccentric gap, would lead to rapid gas depletion in the vicinity of the planet. If multiple planets in adjacent orbits are considered under this condition, a significant expansion of the inner PPD cavity is plausible. This rapid accretion phase would likely halt outward migration due to either the lack of gas material to exert torque on the planet or the circularization of the gap, however. This sequence of events would support the assumption that the outward-migration process is relatively short-lived compared to the life span of the gas disk, thereby our choice of
according to numerical simulations (Dempsey et al. 2021; Scardoni et al. 2022) to ensure an outward migration. This value may change with the addition of extra planets in their calculations.. The increase in the accretion rate, approximately an order of magnitude greater than that of a noneccentric gap, would lead to rapid gas depletion in the vicinity of the planet. If multiple planets in adjacent orbits are considered under this condition, a significant expansion of the inner PPD cavity is plausible. This rapid accretion phase would likely halt outward migration due to either the lack of gas material to exert torque on the planet or the circularization of the gap, however. This sequence of events would support the assumption that the outward-migration process is relatively short-lived compared to the life span of the gas disk, thereby our choice of  (Section 3.1).
In Figure 1, we compute the transition inward- or outwardmigration limit in terms of K (see Equation (8)) as a function of the α-viscosity to determine the planetary migration regime for the planets in HR 8799. The figure shows that a range of α ≈ [3–8] × 10–4 would drive outward migration of the inner planets e, d, and c, while Planet b experiences inward migration.
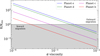 |
Fig. 1 Dependence of the K (see Equation (8)) value for all four planets in HR 8799, which sets the migration direction as a function of α-viscosity for this planet. The values are shown relative to Klim = 1.5 × 10⁴ (Scardoni et al. 2022), which marks the transition between a planet migrating inward or outward. This is highlighted as gray and white regions, respectively. |
3.3 Simulation setup
The protoplanetary disk is assumed to have an initial surface density (Σdd) and aspect ratio (h) profiles as follows:
 (10)
(10)
 (11)
(11)
where r0 is a reference radius, while Σ0 and h0 are the surface density and aspect ratio values at r0, respectively. The disk parameters, planets, and planetesimal disk are in Table 1. Based on Section 3.2 and Figure 1, we set α = 5 × 10⁻⁴ to have an outward migration of the three interior planets and an inward migration of the outermost planet. We build the initial condition by setting the planetary orbital parameters to be in MMR with period ratios 8:4:2:1, assuming prior short-term migration had driven the system into this resonant state. The feasibility of this assumption is discussed in Section 5.
We do not impose gas drag on planetesimals, because it would have a negligible effect compared to other forces. To demonstrate this, we use Equation (12) in Best et al. (2024) (based on Adachi et al. 1976) to calculate the expected planetesimal-migration timescale due to gas3. We use the system parameters in Table 1, and assume the drag coefficient CD ~ 1. Using this, we calculate that a 1 km planetesimal at 150 au, with a bulk density of 1 g cm–3, would have a migration timescale of ~Gyr. The timescale is even longer for larger bodies. These are far longer than the expected < 10 Myr gas-disk lifetime, so we conclude that gas drag would have a negligible effect on planetesimals in our scenarios.
We use MERCURIUS (Rein et al. 2019), a hybrid integrator that switches between the symplectic WHFAST when particles are well separated to IAS 15 when a close encounter occurs. The timestep is set to 0.1 yr but can decrease down to 10–4 yr when a close encounter is detected. We evolve the simulation until it reaches 20 Myr.
4 Results
This section is divided into five parts: in Section 4.1 we present an overview of the proposed evolutionary pathway of HR 8799. Section 4.2 explores the general applicability of the model concerning different sets of parameters. Section 4.3 examines the fiducial model for four planets, showcasing outcomes from a simulation constructed using the parameters outlined in Table 1 while Section 4.4 extends the fiducial model by incorporating a fifth planet. Finally, in Section 4.5, we compare the simulated planetesimal radial profile with the ALMA Band 7 observation (Faramaz et al. 2021).
4.1 Overview of the evolutionary phases in the HR 8799 system
Figure 2 provides a broad overview of our proposed multistage evolution model for the planets in HR 8799, highlighting their correlations with the physical processes occurring in the disk, which we unpack below:
Stage 0: We assume classical convergent migration of the protoplanets, similar to the formation mechanism explored by Goździewski & Migaszewski (2018). In our model, the four planets are trapped in resonance at smaller distances than those currently observed, however; the semimajor axis value for Planet b is lower by about 10% than the current value. These configurations serve as our initial conditions for running the simulations, allowing the outermost planet to push the inner edge of the planetesimal disk outward when it begins to migrate in Stage 1.
Stage 1: the three inner planets migrate outward as the gas disk gradually dissipates. The inner planets will continue migrating until there is no gas to exert torque. As discussed in the Section 3.2, the gas depletion is numerically simulated by incorporating the terms Td and
 with
with  . Note that we are indirectly modeling a faster gas depletion for the three innermost planets with this assumption. The outward movement of these planets also compels Planet b to migrate outward due to MMR, and despite its inward-migration prescription, because of the gas. Additionally, the inner edge of the planetesimal belt is displaced as Planet b moves out into it, resulting in the generation of high-eccentricity bodies, some of which will subsequently enter the inner disk regions, that is, the regions between the star and Planet b.
Stage 2: the new architecture is now wider than the initial configuration but not in alignment with the observed structure. The inner gas disk has nearly been depleted, except in the outer regions close to Planet b, similar to a cavity in a transition disk. This remaining gas will drive Planet b to migrate inward. Following this final migration, the architecture aligns with the current locations of the planets. All planets were likely subjected to migration phases characterized by high accretion rates to achieve the final observed state. For simplicity and due to model limitations, we maintain constant planetary masses and assume a uniform gas disk profile. These simplifications might affect the planet-disk evolution, however, and we explore this topic further in Section 5.
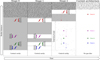 |
Fig. 2 Schematic representation of the proposed evolutionary model for the HR 8799 system. The pair of curves around planets represents the planet under the influence of the primordial gas disk, which is represented as the gray region. By contrast, the gas-free region is colored in white. Finally, the black dots represent the planetesimal bodies. In Stage 0, the protoplanets form and migrate inward until they are stopped at the inner edge and trapped in an MMR. In Stage 1, the three inner planets migrate outward, which compels the outermost planet to also migrate outward due to their MMR chain, even though it would otherwise move inward due to gas drag. This outward movement displaces the inner edge of the planetesimal disk. In Stage 2, the three inner planets cease their outward migration, allowing the outermost planet to resume migrating inward, although this movement is marginal. At this point, the system achieves its current architecture. |
4.2 Parameter dependences and model constraints
Our model relies on the parametrization of the primordial gaseous disk to impose migration regimes on the planets and planetesimals. Naturally, this approximation strongly depends on the parameters used to model the physical interactions. This section explores the impact of varying the most relevant parameters on the final outcome. The model encapsulates planet-disk interactions in the quantities τa,i  , and τe,i, which are crucial for modeling migration. Additionally, the dispersion of the gas disk will determine the migration duration, Td, as well as the duration of the outward migration,
  .
.
We examine how the MMR chain responds to variations in the outward-migration timescale of the three inner planets. Figure 3 shows the result of a grid 20 × 40 different initial conditions integrated over 20 Myr in the ( ) plane. This figure is not a stability map akin to MEGNO (Cincotta & Simό 2000); instead, it depicts a measure of the dispersion of the resonant angle λe – 2λd – λc + 2λb computed as the standard deviation for different simulations, where λi is the mean longitude of a planet i. Simulations exhibiting a large dispersion, i.e., values close to 1, do not belong to a four-planet MMR but may still maintain stable orbits. The crosses represent simulations built in these regimes: the fiducial model in the stable MMR region in green and a simulation inside the unstable zone in black.
As detailed in the Section 3, we have selected a set of reasonable parameters for both planets and disks that yield a stable MMR chain. This is no unique or exotic result, however. Our setup employs parameters within a notorious resonant-keeping region, violet regions in Figure 3. The broad region that keeps the MMR suggests that different initial disk conditions could promote both outward and inward-migration behavior, similar to what we searched for in the fiducial model. While initial conditions of the PPDs remain a topic of ongoing debate, it can be argued that a chain of four super-Jupiter planets could maintain resonances following an outward-migration phase under typical initial disk conditions.
A favorable outcome for the MMR chain may not exactly reproduce the final values of the planets’ semimajor axes and eccentricities. The variables Td and  have an important impact on the final outcome. Some examples of varying these parameters are displayed in Figure 4, which we unpack below.
Panel (FM). This panel represents the evolution of the fiducial model using the parameters outlined in Table 1. It illustrates the archetypal evolution depicted in Figure 2 and will be explained in detail in Section 4.3.
Panel (A). This panel presents the four-planet evolution for a scenario with a longer disk lifetime and duration of the outward migration. In the regime where  , there is a prominent increase in the semimajor axis values, with Planet b experiencing roughly a 62% increase from its initial value to its peak due to the extended duration of the outward-migration mechanism. This scenario requires more time to achieve a steady state without planetary migration movements, however. In this scenario, the final eccentricity values align with those observed; however, the semi major axes exceed the expected values.
Panel (B). This panel illustrates the evolution of the four planets when the two innermost planets are neither set to migrate inward nor outward, i.e.,  Myr, while Planet c is set to migrate outward (
 Myr) and Planet b inward (τa,b = 5 Myr). This scenario could be physically achieved by introducing a larger inner cavity encompassing both innermost planets while the other two remain embedded in the gas disk. To compute the mentioned migration timescales of the migrating planets consistently, we use the same gaseous disk parameters as in Table 1, but adjusting P = 1,
  , and Td = 1 Myr while maintaining the same ratio for
  than the fiducial model, resulting in a value of 0.33 Myr. The outcomes are similar to what we look for the fiducial model with two differences: the increase from the initial value of the semimajor axis of Planet b to its peak is about 12%, half of that of the fiducial model, and the time to reach a steady state is significantly short, achieving it by almost 4 Myr.
Panel (C). This panel illustrates the evolution of a four-planet system where the three innermost planets are not set to migrate either inward or outward, while Planet b is set to migrate inward with τa,b = 10 Myr. This scenario represents the possibility of having the three innermost planets located inside the central gas cavity, while the outermost planets remain embedded in the gas disk. In this setup, the planets gradually acquire eccentricities and slowly migrate inward until, by 5 Myr, the entire system is disrupted.
Changes in Td and  can lead to varying outcomes for the same set of τa,i and
  values. These initial conditions related to both the planets and the disk can be freely explored, with the constraint of achieving the final state observed in HR 8799. The fiducial model shows that an alternative evolutionary pathway for the system is feasible. It is important to note, however that the outcomes derived from these models are not unique. Similar migration behavior to the fiducial model can also be observed in other scenarios, such as cases (A) and (B), indicating that various configurations and pathways, though not exotic, might lead to comparable and stable evolutionary results. Nevertheless, the planetary system may become unstable and disrupted if the three innermost planets reside in the cavity and only the outermost planet migrates inward, as illustrated in case (C).
The case (A) displays a good match in the eccentricity values but not in the semimajor axes, which are larger than those expected. This diskrepancy could be resolved by making the initial planetary architecture even more compact, allowing the expected values to be reached during planetary evolution. On the other hand, the fiducial model assumes that each planet has its own gap, which may be difficult to sustain for a pair of neighboring massive planets that likely would share a common gap (Dong et al. 2015; Kanagawa et al. 2018; Kanagawa & Szuszkiewicz 2020). This scenario is illustrated in case (B), where the two innermost planets are thought to be in the central cavity without interactions with the gas disk. Only planets c and b will therefore experience outward- and inward-migration movements respectively.
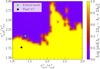 |
Fig. 3 Dependence of maintaining the MMR chain among the three innermost super-Jupiter planets as a function of the ratios |


4.3 Fiducial model. Four planets
As mentioned, Figure 4 (panel FM) shows the evolution of the four planets’ semimajor axes, eccentricities, and the four-planet resonant angle. Complementarily, Figure 5 displays the evolution of resonant angles for pairs and triplets of adjacent planets, along with their period ratios. Finally, Figure 6 depicts the planetesimal disk state at three different times.
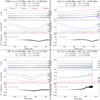 |
Fig. 4 Four examples illustrating the dependence among the final planetary state, the disk lifetime (Td), and the duration of the outward migration ( |


4.3.1 Evolution of the four-planet architecture
All planets experience outward movement when outward migration begins, even though Planet b is configured to migrate inward. This phenomenon can be explained by comparing the migration timescales of Planets b and c, with  . This indicates that the outward movement of Planet c is faster than the inward migration of Planet b. During the first ~ 1 Myr, the eccentricities of the three innermost planets decrease, while the value of Planet b remains relatively unchanged. For this time, the period ratios of all consecutive pairs increase. When the outward migration stops, Planet b begins to migrate inward, the moment at which the migration turns convergent, and the period ratios begin to decrease.
A crucial aspect to note is that even during short-term divergent migration, the resonant chain is preserved, making the system migrate as a block. Although the orbital period ratio for the outermost planetary pair increases to about 2.5, the resonant angle in all configurations continues to oscillate around a fixed value. This deviation from exact commensurability is not inconsistent with resonance; in fact, such behavior is expected at low eccentricities, where the width of the resonance in period ratio increases. Moreover, the center of libration of the resonant angle can shift significantly away from the nominal 2:1 value, depending on the masses and mass ratios of the planets (see, for example, Charalambous et al. 2022).
At the end of the outward migration, Planet b begins to migrate inward due to the imposed condition  . The peak in the outward displacement is reached at 25% of its initial position and continuously decreases later. This inward migration induces the other planets to increase their eccentricities. This effect, referred to as the pantographic effect in Cerioni & Beaugé (2023), is similar to a train, where the entire train moves due to the action of a single locomotive. The ability of Planet e to be influenced by Planet b is facilitated by the resonance chain among the planets; without this resonance, the effect would occur sequentially, progressing inward in pairs from the outermost regions. The inward movement results in a compact planetary architecture as the beginning: the planets experience a modest reduction in their semimajor axes, their eccentricities increase because of the resonant capture, and they approach their initial period ratios relative to their neighbors.
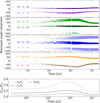 |
Fig. 5 Resonant angles and period ratio evolution for adjacent planets in the fiducial model. Upper panels: resonant angle for each adjacent pair and trio of planets. Bottom panel: evolution of the period ratio of two adjacent planets. |
4.3.2 Morphology of the planetesimal belt
The planetary evolution effects on the planetesimal disk are significant, particularly at the inner edge, as shown in Figure 6. The initial outward movement of Planet b displaces planetesimals initially located between 75 au (the inner rim) and the position where the outer 2:1 resonance takes place at the beginning (~104 au). These planetesimals are either ejected through scattering or swept into MMRs, where they may increase in eccentricity until they cross the planets’ orbits. This interaction could result in either ejection from the system or collisions with the planets (Wyatt et al. 2017), although collisions are not modeled in this work. Such collisions, triggered by orbital instabilities, would be similar to those proposed in the Nice model, contributing to the Late Heavy Bombardment (Bottke & Norman 2017). The crossing-orbit population can be observed at time 1.0 Myr, though the regions near the planets are nearly cleared by the end of the simulation. Notably, one of the most affected planetesimals populations is the one trapped in the 3:2 resonance, which is completely eradicated from its resonance locations; the eccentricities increase until they cross the planets’ orbits and scatter. Some planetesimals trapped in the 2:1 resonance, the closest to Planet b, survive until the end of the simulation. The 2:1 resonance also drives the highest eccentricity values in the trapped bodies, which drives some to close encounters with Planet b.
The formation of the disk’s inner rim with a resonant population parallels the scenario of the Solar System involving Neptune and the Kuiper Belt (Levison & Morbidelli 2003). Although the Kuiper Belt has a significant population at the 3:2 MMR with Neptune (Gladman & Volk 2021), our simulation reveals only a weak accumulation at that location, with most bodies instead concentrating at the 2:1 MMR. The massive gravitational influence of Planet b would likely lead to a concentration at a more-distant MMR due to its more extensive chaotic zone, which, as diskussed, ultimately removes particles trapped at closer MMRs (e.g. Pearce et al. 2024).
Beyond the planetesimal disk inner rim, the influence of high-order resonances is also detectable, particularly the 3:1 resonance, which plays a significant role in exciting the disk locally. Unlike the 2:1 resonance, high-order resonances do not trap a large number of bodies, which leads to the absence of gap regions in the debris disk. Nevertheless, they can excite planetesimals during their sweeping transit through the disk; for example, the 3:1 resonance excites the area between approximately 150 au and 170 au. By the end of the simulation, planetesimals remaining near or within resonant locations exhibit eccentricities below 0.2.
The surface-density profile at the inner rim can be described by an erf function (Rafikov 2023). We fit the following profile to the whole disk, using the method in Pearce et al. (2024):
![Mathematical equation: $\Sigma \left( r \right) = {{{\Sigma _0}} \over 2}\left[ {1 - {\rm{erf}}\left( {{{{r_{{\rm{in}}}} - r} \over {\sqrt 2 {\sigma _{{\rm{in}}}}{r_{{\rm{in}}}}}}} \right)} \right]\left[ {1 - {\rm{erf}}\left( {{{{r_{{\rm{out}}}} - r} \over {\sqrt 2 {\sigma _{{\rm{out}}}}{r_{{\rm{out}}}}}}} \right)} \right]{\left( {{r \over {{r_{{\rm{in}}}}}}} \right)^{ - \gamma }},$](/articles/aa/full_html/2025/08/aa54802-25/aa54802-25-eq49.png) (12)
(12)
where Σ0 is the surface density at rin which is the location of the inner edge of the disk, meanwhile σin is a measure of the edge steepness. rout and σout refer to the outer edge measurements, and γ represents the power law index. The resulting fitting profile is shown in the lower row of Figure 6 and the obtained values for the inner edge region are listed in Table 2. We find that the obtained values are low to correctly reproduce the HR 8799 debris disk measurements even when a smoothing function is applied to the radial profile.
Firstly, both values rin and  for the raw and smoothed data, respectively, are lower than the observed value by the end of the simulation. This is primarily due to a significant number of bodies still being located within 145 au, as illustrated in Figure 6. Based on this, we find that a four-planet architecture is unable to produce a sufficiently large cavity size, even for the scenario of outward migration. Nevertheless, it can create a larger cavity than that seen in nonmigrating scenarios (Read et al. 2018).
Secondly, the final σin value obtained, 0.04, is also low compared to the observed value. This value is associated with the eccentricity of the planetesimals; a lower eccentricity results in a steeper edge and, hence, a smaller sigma value. The value is also sensitive to the smoothing effect of applying a filter or beam, however. This effect becomes evident when examining the  value, derived by applying a Gaussian beam size of 43 au to the raw data; the same beam size as Faramaz et al. (2021) employed on their data. Although a beam effect can produce high σin values, the observed value better aligns with the presence of a scattered population within the disk (see Section 2). In our four-planet simulation, the highest σin value is obtained at 1.0 Myr, corresponding to the initial stages where the excitation level is primarily influenced by Planet b. By the end of the simulation, the number of highly excited planetesimals decreases, leading to a corresponding decline in the σin value.
The inconsistencies noted in the edge size and shape of the inner disk raise questions about the feasibility of the current four-planet model. This edge size issue is also observed in β Pictoris between its debris disk and its two detected planets; Lacquement et al. (2025) examined the possibility that additional planets could carve a larger cavity, which would align with the observations. This prompts us to investigate a similar scenario in which we incorporate an extra body to determine whether these changes could replicate the observed characteristics better.
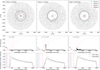 |
Fig. 6 Snapshots showing the evolution of planetesimals at 0, 1.0, and 20 Myr from left to right. The upper row displays the planetesimal distribution in the xy-plane, the planets in colors (color-coded as in Figure 2), and the dashed black circle represents the proposed 145 au value of the observed central cavity. The middle row shows the ae-plane as colored circles with the instantaneous values and crosses with the observed values. The vertical lines represent the location of the MMR for the 1:1, 3:2, 2:1, 5:2, and 3:1 resonances referring to the outermost planet (Planet b), and the red curve represents the minimum eccentricities required for debris to come within 3 Hill radii of Planet b. The lower row shows the normalized surface density profile. The dots indicate the radial bins for the surface density, and the solid and dashed black lines represent the fitted curve according to Equation (12) for the raw data and the data smoothed by a Gaussian beam size of 43 au, respectively. The locations of the planets are marked by vertical lines for reference. |
4.4 Fiducial model. Five planets
We incorporate a fifth planet, referred to as Planet x, which is initially positioned in a nonresonant orbit with an inclination of 0.5° and eccentricity of 0.01. This configuration is selected because there is no evidence for a globally eccentric outer debris disk (see Section 2.1) that would suggest an initially excited configuration. Planet x is initialized at 100 au, close to the 2:1 resonance location relative to Planet b. These assumptions contribute to a rapid orbital kick of Planet x due to dynamical orbital instabilities triggered by Planet b. While this effect can occur in other locations of MMR, we chose the 2:1 resonant location to ensure consistency with the overall planetary architecture. The considered mass is set to 0.025 MJup (≈ 8 M⊕) which stays below the detection threshold. It is near the mass limit suggested by Read et al. (2018) to reproduce the radial profile without disrupting the stability of the other planets or causing a loss of the MMR. We enforce that Planet x undergoes inward migration similar to Planet b, with a migration timescale of τa,x = 8 Myr. Additionally, the initial inner edge of the planetesimal disk is set further at 110 au. The rest of the disk and planets parameters are the same as listed in Table 1, the fiducial model.
Due to the expected orbital instability arising from the interaction between Planet b and Planet x, the dynamical behavior of Planet x is anticipated to be chaotic. To assess possible outcomes, we ran 200 simulations featuring only the five planets, varying the Planet x semimajor axis and true anomaly randomly within the ranges of 95–115 au and 0–360°, respectively. The range in the semimajor axis spans the region between the 3:2 and 2:1 MMR locations with Planet b. Figure 7 shows the evolution of these quantities. The simulations indicate a preferred evolutionary pathway for Planet x: almost 70% of the simulations follow the pathway represented by the two thickest lines at roughly 1 Myr, increasing to 80% by the end, which corresponds to a close location with the 2:1 MMR of Planet b. We employed the setup highlighted in red, and although it represents roughly 10% of the simulations’ starting behavior (where their eccentricities increase abruptly), it maximizes the number of scattered bodies during the early stages, but ends up similar to most of the simulations.
Figures 8 and 9 illustrate the evolutionary state of a planetary system and its planetesimal disk across three epochs for a scenario consisting of five planets. We find that the additional planet does not affect significantly the evolution of the four innermost planets compared to the fiducial model. The gradual outward migration of Planet b and the inward motion of Planet x bring their orbits closer together. This convergence continues until Planet x enters the chaotic zone of Planet b, leading to dynamical instability. Around 0.13 Myr, this interaction triggers a sudden jump in both the semimajor axis and eccentricity of Planet x. As a result, the fifth planet is displaced to a larger radial distance, embedding it within the planetesimal disk. After this displacement, Planet x continues its inward migration and eventually becomes trapped in a 2:1 resonance with Planet b, without forming a multiresonant state with the other planets. Note that in order to have a resonance between two planets, at least one of the resonant angles needs to librate, not both. In our simulations, even when the two planet angles ϕ1 = 2λb – λc – ϖb,c and ϕ2,b = 2λx – λb – ϖb (see Figure 8 right panels) exhibit bounded libration, ϕ2,x = 2λx – λb – ϖx does not. For this reason, their difference ϕ2 – ϕ1 = λc – 3λb + 2λx involving the three planets does not librate. Consequently, the four-planet angle involving Planet x oscillates as well.
The jump in radial distance of Planet x significantly impacts the planetesimal disk, as it moves inward. This leads to the formation of a population of co-rotational planetesimals in the early stages of evolution and noticeably excites surrounding bodies. The excited bodies reach distances up to 250 au, a range not reached in the four-planet simulation. The highly eccentric bodies interact with Planet b as well as Planet x, resulting in outcomes similar to the four-planet simulation, where they cross the orbits of interior planets and are subsequently ejected. Ultimately, a considerably larger number of high-eccentricity planetesimals survive, delineating the boundary in the ae-plane equivalent to 3 Hill radii of Planet x, consistent with expectations for a scattered population (Gladman 1993; Ida et al. 2000a,b; Pearce et al. 2022).
The resulting values of rin and σin in this case better explain the observations than the four-planet case scenario listed in Table 2. By the end of the simulation, with Planet x at approximately 120 au, the rin value aligns with observations at 160 au. Even though σin is almost twice higher than in the four-planet case, which implies a huge number of high-eccentricity bodies, the value still remains insufficient; our simulated disk edge is still steeper than in the observed disk.
Fitting parameters for the inner edge of the disk in the four-and five-planet models.
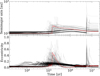 |
Fig. 7 Evolution of the semimajor axis and eccentricity of Planet x in the five-planet model for varying initial conditions. The gray lines indicate 200 simulations employing the IAS 15 integrator with different initial values for the semimajor axis and true anomaly of Planet x. The red line represents the case displayed in Figures 8 and 9. |
4.5 The radial profile of the surface density
The radial profile presented in Faramaz et al. (2021) reveals an asymmetric and unsharp profile at the inner edge between 100 and 200 au. The shape of the inner edge is consistent with the existence of a high-eccentricity component or an unsharp cutoff in the distribution of the semimajor axes (Marino 2021; Pearce et al. 2024).
Figure 10 compares the ALMA Band 7 observation with our simulation results. In contrast to the radial profiles produced by the four- and five-planet simulations, the observed profile appears broader and flatter around its peak intensity at about 200 au. The four-planet simulation does not replicate the shape and steepness of the inner edge even when planetary migration is accounted for. While the five-planet profile effectively matches the peak intensity location and the size of the inner edge, it still fails to capture the steepness and shape of the observed data. This suggests that additional factors may influence the surface density profile of HR 8799, and that these factors are not accounted for in our current models.
The complexity of the disk profile suggests that various mechanisms may be at play that can generate and sustain a significant number of eccentric bodies. One such mechanism is the influence of a dwarf planet embedded within the planetesimal disk (Ida & Makino 1993; Kirsh et al. 2009; Friebe et al. 2022; Costa et al. 2024). A dwarf planet (or planets) would effectively account for the high levels of eccentricity within the disk, acting similarly to Pluto in our Solar System by exciting nearby planetesimals without significantly clearing its own orbit (see Gladman & Volk 2021, for a review on transneptunian objects). This scenario also agrees with proposed Pluto formation models that involve the outward-migration phase of Neptune (Malhotra 1993), similar to our migration model. Self-stirring is another potential source of eccentricity excitation. This results from the self-gravity of bodies within the debris disk (Kennedy & Wyatt 2010; Krivov & Booth 2018; Poblete et al. 2023). A third possibility are collisions between planetesimals that would cause a fainter edge profile (Imaz Blanco et al. 2023). The combined effect of collisions and planetary sculpting would produce a smoother kinked edge than planets alone. This appears to be similar to the edge of the observed disk (Figure 13 in Pearce et al. 2024).
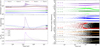 |
Fig. 8 Evolution of selected orbital parameters in the five-planet model. Left: evolution of the planetary semimajor axes, eccentricities, and the period ratio of adjacent-planet pairs. The results for planets e, d, c, b, and x are depicted with the same color-coding as in Figure 2, plus violet for Planet x. The gray region indicates the outer chaotic zone for Planet b, defined as 3 Hill radii. Right: resonant angles for each adjacent pair, trio, and quartet of planets. |
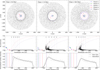 |
Fig. 9 Same as Figure 6, but with an additional planet. The MMR lines are plotted with respect to Planet x. |
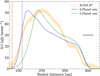 |
Fig. 10 Radial intensity for the ALMA observation (orange line) along with our two relative intensity profiles for the four- and five-planet simulation in blue and green, respectively. The relative intensity of the simulation was calculated assuming that the planetesimals emit as blackbodies, following the relation I(r) ∝ Σ(r)r–1/2. The intensity was smoothed using a Gaussian filter of 43 au. The beam size is shown as the black line. The locations of Planet b (red) and Planet x (violet) are marked by vertical lines for reference. |
5 Discussion
It is complicated to trace the dynamical history of a planetary system, even for our Solar System. As we showed in Section 2, the HR 8799 system has significant pieces of information based on which we may to try to trace its past. Our model used the available constraints and explored an evolutionary pathway suitable for super-Jupiter planets in a resonant chain. The parameterization of the migration regimes provides a reasonably good approach to modeling the system; nevertheless, both the model and observations have essential aspects to highlight and discuss.
One of our key hypotheses is that the four super-Jupiters formed rapidly and efficiently. This assumption is critical for initiating the outward migration during the early stages of planetary formation when enough gas is present to drive Planet b inward. Therefore, a swift planetary system formation is necessary, along with an efficient mechanism to trap consecutive pairs of planets into a 2:1 MMR and sufficient time to allow the subsequent outward and inward migration.
Recent observations suggest that the gap-opening process associated with massive planet formation can commence as early as approximately 0.5 Myr (Segura-Cox et al. 2020), and potentially even at ages less than 0.2 Myr (Maureira et al. 2024). This implies that at least one Jupiter-like planet is already present at such an early stage. Lambrechts & Johansen (2012) estimated the time needed to reach the critical core mass (10 M⊕) via pebble accretion, which is necessary for starting gas accretion. By applying our radial locations (ainit) and surface density values, we determine the timescales to be 0.24, 0.23, 0.25, and 0.29 Myr for Planets e, d, c, and b, respectively, all of which are less than 0.5 Myr. Notably, Planet d would form first, potentially explaining its higher mass as suggested by models (see Section 2.1). Additionally, the hypothetical Planet x would require 0.34 Myr to achieve a mass of 8 M⊕.
Lau et al. (2024) have shown a sequential inside-out planet formation mechanism, whereby the formation of one gap-opening planet creates pressure maxima at the edge, triggering the formation of an adjacent planet. This process also results in the planets trapped in a 2:1 resonant chain, supporting part of the initial conditions of our hypothesis. Such a mechanism primarily investigates the formation of gas and ice giants without considering larger planets, but more massive planets were not considered.
Regarding planetary growth, Lambrechts et al. (2019) estimates that the accretion rate of planets could reach values as high as 10 Mjup/Myr. Conversely, the minimum gas mass required to form the observed planets in HR 8799 is approximately 0.03 M⊕, likely concentrated within the inner 100 au. The size of the debris disk suggests an initial disk extension of around 400 au or even more. Consequently, the total initial disk mass would be significantly larger, and according to the disk-to-star mass ratios deduced by Andrews et al. (2013), it could approach 0.1 M⊕. Fast gas accretion, supported by a substantial mass reservoir, could facilitate the rapid growth of protoplanets, reaching their current masses within the first million years.
The timing of the onset of outward migration for the three inner planets is also crucial for assessing the efficiency of the process. As explained in Section 3.2, outward migration is driven by the formation of an eccentric gap, which typically occurs for planetary masses larger than 3 Mjup. The values we used to compute migration timescales align with the present measurements for the planets’ masses, all of which are greater than 6 Mjup. The calculated dynamical masses of the HR 8799 planets can vary depending on the star model used; however, most models concur that all planetary masses are similar, except for the outermost planet, which is less massive than the rest. This implies that the three inner planets may have formed almost simultaneously, while the outermost planet could have formed slightly later (Bergez-Casalou et al. 2023). Consequently, the outward migration of the three inner planets might have begun during their growth phase, occurring relatively simultaneously. This results in a distinct set of parameters for the three planets migrating outward. Moreover, the τa,i and  values are derived from single-planet simulations; introducing a pair of planets could alter the total torques, affecting the timescale and/or direction of migration.
The eccentricity imprinted on the disk by the eccentric gaps would modify the torques experienced by the planetesimals (which are initially assumed to be circular and massless in our model), potentially altering their migration timescales and leading to a different final architecture and morphology of the debris disk than we observed (see eccentric debris disks in Kennedy 2020, for instance). While the super-Jupiter planets are too massive to be significantly influenced by planetesimal-induced migration, this effect could be significant for a potential fifth planet (Planet x) and any smaller bodies, including dwarf planets, embedded within the planetesimal disk (Kirsh et al. 2009; Ormel et al. 2012; Friebe et al. 2022). These smaller bodies may then have played an important role in sculpting the observed structure of the HR 8799 debris disk after the gas disk disappeared.
6 Conclusion
We performed self-consistent N-body simulations of a planetary system consisting of four super-Jupiter planets under both outward- and inward-migration regimes, as well as a planetesimal disk with massless particles to explain the HR 8799 architecture for the planets and the cold debris disk. Our main findings are summarized below:
- (i)
Stability and robustness of resonance: The resonant configuration of the four planets can be maintained during outward migration when the migration rate is not excessive. When the outward migration is too fast, however, or when only the outermost planet migrates inward, the resonant structure can be disrupted. This ultimately destabilizes the planetary architecture;
- (ii)
disk structure and the role of an additional planet: The outward migration of the observed four planets significantly excites the planetesimal disk, which leads to a transient scattered population and expands the inner cavity beyond the predictions of models without migration. This alone does not fully reproduce the observed debris disk, however. Our results indicate that the presence of a fifth planet beyond the orbit of Planet b improves the agreement with observations because it undergoes an initial instability before settling into a wider orbit. This additional planet helps to shape the debris disk. This suggests that unseen planetary companions may play a key role in sculpting the system architecture.
We propose a reinterpretation of the planetary architecture and disk morphology of the system HR 8799 that incorporates a phase of outward planetary migration. While this model provides a partial explanation for several key features, it relies on specific initial conditions, migration regimes, and parameter choices. This highlights the need for further investigation into the broader range of dynamical processes that may influence the evolution of planetary systems. The complex interplay between inward and outward migration, along with resonant interactions, emphasizes the limitations of our current understanding and the necessity for more comprehensive models that encompass a wider variety of initial conditions and dynamic processes.
Data availability
The corresponding author will share the data underlying this article at a reasonable request.
Acknowledgements
The authors thank the anonymous reviewer for the thorough and useful report. We acknowledge Antranik A. Sefilian for his valuable help and support throughout this work. The authors also thank Virginie Faramaz for providing the HR 8799 ALMA data. P.P.P. is supported by the European Research Council (ERC) under the European Union Horizon Europe programme (grant agreement No. 101042275, project Stellar-MADE). T.D.P. is supported by UKRI/EPSRC through a Stephen Hawking Fellowship. C.C. is supported by ANID through FONDECYT grant No. 3230283.
References
- Adachi, I., Hayashi, C., & Nakazawa, K. 1976, Progr. Theor. Phys., 56, 1756 [Google Scholar]
- Ali-Dib, M., Marsset, M., Wong, W.-C., & Dbouk, R. 2021, AJ, 162, 19 [Google Scholar]
- Andrews, S. M., Rosenfeld, K. A., Kraus, A. L., & Wilner, D. J. 2013, ApJ, 771, 129 [Google Scholar]
- Armitage, P. J. 2018, in Handbook of Exoplanets, eds. H. J. Deeg, & J. A. Belmonte, 135 [Google Scholar]
- Baines, E. K., White, R. J., Huber, D., et al. 2012, ApJ, 761, 57 [NASA ADS] [CrossRef] [Google Scholar]
- Balmer, W. O., Kammerer, J., Pueyo, L., et al. 2025, AJ, 169, 209 [Google Scholar]
- Beaugé, C., Michtchenko, T. A., & Ferraz-Mello, S. 2006, MNRAS, 365, 1160 [Google Scholar]
- Bell, C. P. M., Mamajek, E. E., & Naylor, T. 2015, MNRAS, 454, 593 [Google Scholar]
- Bergez-Casalou, C., Bitsch, B., & Raymond, S. N. 2023, A&A, 669, A129 [NASA ADS] [CrossRef] [EDP Sciences] [Google Scholar]
- Best, M., Sefilian, A. A., & Petrovich, C. 2024, ApJ, 960, 89 [Google Scholar]
- Bitsch, B., Crida, A., Libert, A. S., & Lega, E. 2013, A&A, 555, A124 [NASA ADS] [CrossRef] [EDP Sciences] [Google Scholar]
- Boccaletti, A., Mâlin, M., Baudoz, P., et al. 2024, A&A, 686, A33 [NASA ADS] [CrossRef] [EDP Sciences] [Google Scholar]
- Booth, M., Jordán, A., Casassus, S., et al. 2016, MNRAS, 460, L10 [NASA ADS] [CrossRef] [Google Scholar]
- Borucki, W. J., Koch, D., Basri, G., et al. 2010, Science, 327, 977 [Google Scholar]
- Bottke, W. F., & Norman, M. D. 2017, Annu. Rev. Earth Planet. Sci., 45, 619 [Google Scholar]
- Bowler, B. P. 2016, PASP, 128, 102001 [Google Scholar]
- Brandt, G. M., Brandt, T. D., Dupuy, T. J., Michalik, D., & Marleau, G.-D. 2021, ApJ, 915, L16 [NASA ADS] [CrossRef] [Google Scholar]
- Cerioni, M., & Beaugé, C. 2023, ApJ, 954, 57 [NASA ADS] [CrossRef] [Google Scholar]
- Charalambous, C., Teyssandier, J., & Libert, A. S. 2022, MNRAS, 514, 3844 [NASA ADS] [CrossRef] [Google Scholar]
- Chen, Y.-X., Zhang, X., Li, Y.-P., Li, H., & Lin, D. N. C. 2020, ApJ, 900, 44 [NASA ADS] [CrossRef] [Google Scholar]
- Cincotta, P. M., & Sim?, C. 2000, A&AS, 147, 205 [NASA ADS] [CrossRef] [EDP Sciences] [Google Scholar]
- Costa, T., Pearce, T. D., & Krivov, A. V. 2024, MNRAS, 527, 7317 [Google Scholar]
- D’Angelo, G., Lubow, S. H., & Bate, M. R. 2006, ApJ, 652, 1698 [CrossRef] [Google Scholar]
- Dempsey, A. M., Muñoz, D. J., & Lithwick, Y. 2021, ApJ, 918, L36 [CrossRef] [Google Scholar]
- Dong, R., Zhu, Z., Rafikov, R. R., & Stone, J. M. 2015, ApJ, 809, L5 [Google Scholar]
- Duffell, P. C., & MacFadyen, A. I. 2013, ApJ, 769, 41 [NASA ADS] [CrossRef] [Google Scholar]
- Esposito, S., Mesa, D., Skemer, A., et al. 2013, A&A, 549, A52 [NASA ADS] [CrossRef] [EDP Sciences] [Google Scholar]
- Fabrycky, D. C., & Murray-Clay, R. A. 2010, ApJ, 710, 1408 [NASA ADS] [CrossRef] [Google Scholar]
- Faramaz, V., Marino, S., Booth, M., et al. 2021, AJ, 161, 271 [NASA ADS] [CrossRef] [Google Scholar]
- Friebe, M. F., Pearce, T. D., & Löhne, T. 2022, MNRAS, 512, 4441 [Google Scholar]
- Fung, J., Shi, J.-M., & Chiang, E. 2014, ApJ, 782, 88 [NASA ADS] [CrossRef] [Google Scholar]
- Gaia Collaboration (Brown, A. G. A., et al.) 2021, A&A, 649, A1 [NASA ADS] [CrossRef] [EDP Sciences] [Google Scholar]
- Geiler, F., Krivov, A. V., Booth, M., & Löhne, T. 2019, MNRAS, 483, 332 [NASA ADS] [CrossRef] [Google Scholar]
- Gladman, B. 1993, Icarus, 106, 247 [Google Scholar]
- Gladman, B., & Volk, K. 2021, ARA&A, 59, 203 [Google Scholar]
- Goldreich, P., & Schlichting, H. E. 2014, AJ, 147, 32 [Google Scholar]
- Goldreich, P., & Tremaine, S. 1979, ApJ, 233, 857 [Google Scholar]
- Goldreich, P., & Tremaine, S. 1980, ApJ, 241, 425 [Google Scholar]
- Gomes, R., Levison, H. F., Tsiganis, K., & Morbidelli, A. 2005, Nature, 435, 466 [Google Scholar]
- Gozdziewski, K., & Migaszewski, C. 2018, ApJS, 238, 6 [Google Scholar]
- Gozdziewski, K., & Migaszewski, C. 2020, ApJ, 902, L40 [CrossRef] [Google Scholar]
- GRAVITY Collaboration (Lacour, S., et al.) 2019, A&A, 623, L11 [NASA ADS] [CrossRef] [EDP Sciences] [Google Scholar]
- Gray, R. O., & Kaye, A. B. 1999, AJ, 118, 2993 [NASA ADS] [CrossRef] [Google Scholar]
- Gray, R. O., Corbally, C. J., Garrison, R. F., McFadden, M. T., & Robinson, P. E. 2003, AJ, 126, 2048 [Google Scholar]
- Griveaud, P., Crida, A., Petit, A. C., Lega, E., & Morbidelli, A. 2024, A&A, 688, A202 [NASA ADS] [CrossRef] [EDP Sciences] [Google Scholar]
- Hahn, J. M., & Malhotra, R. 2005, AJ, 130, 2392 [Google Scholar]
- Haisch, Karl E., J., Lada, E. A., & Lada, C. J. 2001, ApJ, 553, L153 [Google Scholar]
- Hughes, A. M., Wilner, D. J., Andrews, S. M., et al. 2011, ApJ, 740, 38 [NASA ADS] [CrossRef] [Google Scholar]
- Ida, S., & Makino, J. 1993, Icarus, 106, 210 [NASA ADS] [CrossRef] [Google Scholar]
- Ida, S., Bryden, G., Lin, D. N. C., & Tanaka, H. 2000a, ApJ, 534, 428 [NASA ADS] [CrossRef] [Google Scholar]
- Ida, S., Larwood, J., & Burkert, A. 2000b, ApJ, 528, 351 [Google Scholar]
- Imaz Blanco, A., Marino, S., Matrà, L., et al. 2023, MNRAS, 522, 6150 [NASA ADS] [CrossRef] [Google Scholar]
- Kanagawa, K. D., & Szuszkiewicz, E. 2020, ApJ, 894, 59 [NASA ADS] [CrossRef] [Google Scholar]
- Kanagawa, K. D., Tanaka, H., Muto, T., Tanigawa, T., & Takeuchi, T. 2015, MNRAS, 448, 994 [NASA ADS] [CrossRef] [Google Scholar]
- Kanagawa, K. D., Tanaka, H., & Szuszkiewicz, E. 2018, ApJ, 861, 140 [Google Scholar]
- Kaye, A. B., Handler, G., Krisciunas, K., Poretti, E., & Zerbi, F. M. 1999, PASP, 111, 840 [Google Scholar]
- Kennedy, G. M. 2020, Roy. Soc. Open Sci., 7, 200063 [NASA ADS] [CrossRef] [Google Scholar]
- Kennedy, G. M., & Wyatt, M. C. 2010, MNRAS, 405, 1253 [NASA ADS] [Google Scholar]
- Kirsh, D. R., Duncan, M., Brasser, R., & Levison, H. F. 2009, Icarus, 199, 197 [NASA ADS] [CrossRef] [Google Scholar]
- Kley, W., & Dirksen, G. 2006, A&A, 447, 369 [NASA ADS] [CrossRef] [EDP Sciences] [Google Scholar]
- Konopacky, Q. M., Marois, C., Macintosh, B. A., et al. 2016, AJ, 152, 28 [NASA ADS] [CrossRef] [Google Scholar]
- Krivov, A. V., & Booth, M. 2018, MNRAS, 479, 3300 [NASA ADS] [CrossRef] [Google Scholar]
- Lacquement, A., Beust, H., Faramaz-Gorka, V., & Duchêne, G. 2025, A&A, 694, A236 [NASA ADS] [CrossRef] [EDP Sciences] [Google Scholar]
- Lambrechts, M., & Johansen, A. 2012, A&A, 544, A32 [NASA ADS] [CrossRef] [EDP Sciences] [Google Scholar]
- Lambrechts, M., Lega, E., Nelson, R. P., Crida, A., & Morbidelli, A. 2019, A&A, 630, A82 [NASA ADS] [CrossRef] [EDP Sciences] [Google Scholar]
- Lau, T. C. H., Birnstiel, T., Drazkowska, J., & Stammler, S. M. 2024, A&A, 688, A22 [NASA ADS] [CrossRef] [EDP Sciences] [Google Scholar]
- Lee, M. H., & Peale, S. J. 2002, ApJ, 567, 596 [Google Scholar]
- Levison, H. F., & Morbidelli, A. 2003, Nature, 426, 419 [Google Scholar]
- Levison, H. F., Morbidelli, A., Van Laerhoven, C., Gomes, R., & Tsiganis, K. 2008, Icarus, 196, 258 [Google Scholar]
- Lin, D. N. C., & Papaloizou, J. 1979, MNRAS, 186, 799 [Google Scholar]
- Liu, B., Ormel, C. W., & Lin, D. N. C. 2017, A&A, 601, A15 [NASA ADS] [CrossRef] [EDP Sciences] [Google Scholar]
- Liu, B., Raymond, S. N., & Jacobson, S. A. 2022, Nature, 604, 643 [NASA ADS] [CrossRef] [Google Scholar]
- Maire, A. L., Skemer, A. J., Hinz, P. M., et al. 2015, A&A, 576, A133 [NASA ADS] [CrossRef] [EDP Sciences] [Google Scholar]
- Malhotra, R. 1993, Nature, 365, 819 [CrossRef] [Google Scholar]
- Mamajek, E. E. 2009, in American Institute of Physics Conference Series, 1158, Exoplanets and Disks: Their Formation and Diversity, eds. T. Usuda, M. Tamura, & M. Ishii (AIP), 3 [NASA ADS] [CrossRef] [Google Scholar]
- Marino, S. 2021, MNRAS, 503, 5100 [NASA ADS] [CrossRef] [Google Scholar]
- Marois, C., Macintosh, B., Barman, T., et al. 2008, Science, 322, 1348 [Google Scholar]
- Marois, C., Zuckerman, B., Konopacky, Q. M., Macintosh, B., & Barman, T. 2010, Nature, 468, 1080 [NASA ADS] [CrossRef] [Google Scholar]
- Matthews, B., Kennedy, G., Sibthorpe, B., et al. 2014, ApJ, 780, 97 [NASA ADS] [CrossRef] [Google Scholar]
- Maureira, M. J., Pineda, J. E., Liu, H. B., et al. 2024, A&A, 689, L5 [NASA ADS] [CrossRef] [EDP Sciences] [Google Scholar]
- Mayor, M., & Queloz, D. 1995, Nature, 378, 355 [Google Scholar]
- Morbidelli, A., Levison, H. F., Tsiganis, K., & Gomes, R. 2005, Nature, 435, 462 [Google Scholar]
- Moya, A., Amado, P. J., Barrado, D., et al. 2010a, MNRAS, 405, L81 [NASA ADS] [CrossRef] [Google Scholar]
- Moya, A., Amado, P. J., Barrado, D., et al. 2010b, MNRAS, 406, 566 [NASA ADS] [CrossRef] [Google Scholar]
- Nasedkin, E., Mollière, P., Lacour, S., et al. 2024, A&A, 687, A298 [NASA ADS] [CrossRef] [EDP Sciences] [Google Scholar]
- Nelson, R. P. 2018, in Handbook of Exoplanets, eds. H. J. Deeg, & J. A. Belmonte, 139 [Google Scholar]
- Nelson, R. P., & Papaloizou, J. C. B. 2002, MNRAS, 333, L26 [CrossRef] [Google Scholar]
- Nesvorný, D., & Morbidelli, A. 2012, AJ, 144, 117 [Google Scholar]
- Ormel, C. W., Ida, S., & Tanaka, H. 2012, ApJ, 758, 80 [Google Scholar]
- Papaloizou, J. C. B., & Terquem, C. 2006, Rep. Progr. Phys., 69, 119 [Google Scholar]
- Pearce, T. D., Launhardt, R., Ostermann, R., et al. 2022, A&A, 659, A135 [NASA ADS] [CrossRef] [EDP Sciences] [Google Scholar]
- Pearce, T. D., Krivov, A. V., Sefilian, A. A., et al. 2024, MNRAS, 527, 3876 [Google Scholar]
- Poblete, P. P., Löhne, T., Pearce, T. D., & Sefilian, A. A. 2023, MNRAS, 526, 2017 [Google Scholar]
- Rafikov, R. R. 2023, MNRAS, 519, 5607 [Google Scholar]
- Read, M. J., Wyatt, M. C., Marino, S., & Kennedy, G. M. 2018, MNRAS, 475, 4953 [NASA ADS] [CrossRef] [Google Scholar]
- Rein, H., & Liu, S. F. 2012, A&A, 537, A128 [NASA ADS] [CrossRef] [EDP Sciences] [Google Scholar]
- Rein, H., Hernandez, D. M., Tamayo, D., et al. 2019, MNRAS, 485, 5490 [Google Scholar]
- Rhee, J. H., Song, I., Zuckerman, B., & McElwain, M. 2007, ApJ, 660, 1556 [Google Scholar]
- Ricker, G. R., Winn, J. N., Vanderspek, R., et al. 2015, J. Astron. Telesc. Instrum. Syst., 1, 014003 [Google Scholar]
- Sadakane, K. 2006, PASJ, 58, 1023 [NASA ADS] [Google Scholar]
- Scardoni, C. E., Clarke, C. J., Rosotti, G. P., et al. 2022, MNRAS, 514, 5478 [NASA ADS] [CrossRef] [Google Scholar]
- Schneider, J., Dedieu, C., Le Sidaner, P., Savalle, R., & Zolotukhin, I. 2011, A&A, 532, A79 [NASA ADS] [CrossRef] [EDP Sciences] [Google Scholar]
- Segura-Cox, D. M., Schmiedeke, A., Pineda, J. E., et al. 2020, Nature, 586, 228 [NASA ADS] [CrossRef] [Google Scholar]
- Shakura, N. I., & Sunyaev, R. A. 1973, A&A, 24, 337 [NASA ADS] [Google Scholar]
- Snellgrove, M. D., Papaloizou, J. C. B., & Nelson, R. P. 2001, A&A, 374, 1092 [NASA ADS] [CrossRef] [EDP Sciences] [Google Scholar]
- Su, K. Y. L., Rieke, G. H., Stapelfeldt, K. R., et al. 2009, ApJ, 705, 314 [Google Scholar]
- Tamayo, D., Rein, H., Shi, P., & Hernandez, D. M. 2020, MNRAS, 491, 2885 [NASA ADS] [CrossRef] [Google Scholar]
- Tanaka, Y. A., Kanagawa, K. D., Tanaka, H., & Tanigawa, T. 2022, ApJ, 925, 95 [NASA ADS] [CrossRef] [Google Scholar]
- Thompson, W., Marois, C., Do Ó, C. R., et al. 2023, AJ, 165, 29 [NASA ADS] [CrossRef] [Google Scholar]
- Tsiganis, K., Gomes, R., Morbidelli, A., & Levison, H. F. 2005, Nature, 435, 459 [Google Scholar]
- Wang, J. J., Graham, J. R., Dawson, R., et al. 2018, AJ, 156, 192 [Google Scholar]
- Williams, J. P., & Cieza, L. A. 2011, ARA&A, 49, 67 [Google Scholar]
- Wilner, D. J., MacGregor, M. A., Andrews, S. M., et al. 2018, ApJ, 855, 56 [NASA ADS] [CrossRef] [Google Scholar]
- Wisdom, J. 1980, AJ, 85, 1122 [NASA ADS] [CrossRef] [Google Scholar]
- Wyatt, M. C., Bonsor, A., Jackson, A. P., Marino, S., & Shannon, A. 2017, MNRAS, 464, 3385 [Google Scholar]
- Zerbi, F. M., Rodríguez, E., Garrido, R., et al. 1999, MNRAS, 303, 275 [NASA ADS] [CrossRef] [Google Scholar]
- Zuckerman, B., & Song, I. 2012, ApJ, 758, 77 [Google Scholar]
- Zurlo, A., Vigan, A., Galicher, R., et al. 2016, A&A, 587, A57 [NASA ADS] [CrossRef] [EDP Sciences] [Google Scholar]
- Zurlo, A., Gozdziewski, K., Lazzoni, C., et al. 2022, A&A, 666, A133 [NASA ADS] [CrossRef] [EDP Sciences] [Google Scholar]
Taken from the encyclopedia of exoplanetary systems Schneider et al. (2011), website: https://exoplanet.eu/catalog/
This estimate, however, is debated. For instance Wilner et al. (2018) report a value of  au based on combined SMA and ALMA data.
Note that ρ in Equation (12) of Best et al. (2024) actually denotes gas density, rather than planetesimal bulk density as written in that paper.
All Tables
Fitting parameters for the inner edge of the disk in the four-and five-planet models.
All Figures
|
Fig. 1 Dependence of the K (see Equation (8)) value for all four planets in HR 8799, which sets the migration direction as a function of α-viscosity for this planet. The values are shown relative to Klim = 1.5 × 10⁴ (Scardoni et al. 2022), which marks the transition between a planet migrating inward or outward. This is highlighted as gray and white regions, respectively. |
| In the text | |
|
Fig. 2 Schematic representation of the proposed evolutionary model for the HR 8799 system. The pair of curves around planets represents the planet under the influence of the primordial gas disk, which is represented as the gray region. By contrast, the gas-free region is colored in white. Finally, the black dots represent the planetesimal bodies. In Stage 0, the protoplanets form and migrate inward until they are stopped at the inner edge and trapped in an MMR. In Stage 1, the three inner planets migrate outward, which compels the outermost planet to also migrate outward due to their MMR chain, even though it would otherwise move inward due to gas drag. This outward movement displaces the inner edge of the planetesimal disk. In Stage 2, the three inner planets cease their outward migration, allowing the outermost planet to resume migrating inward, although this movement is marginal. At this point, the system achieves its current architecture. |
| In the text | |
|
Fig. 3 Dependence of maintaining the MMR chain among the three innermost super-Jupiter planets as a function of the ratios |
| In the text | |
|
Fig. 4 Four examples illustrating the dependence among the final planetary state, the disk lifetime (Td), and the duration of the outward migration ( |
| In the text | |
|
Fig. 5 Resonant angles and period ratio evolution for adjacent planets in the fiducial model. Upper panels: resonant angle for each adjacent pair and trio of planets. Bottom panel: evolution of the period ratio of two adjacent planets. |
| In the text | |
|
Fig. 6 Snapshots showing the evolution of planetesimals at 0, 1.0, and 20 Myr from left to right. The upper row displays the planetesimal distribution in the xy-plane, the planets in colors (color-coded as in Figure 2), and the dashed black circle represents the proposed 145 au value of the observed central cavity. The middle row shows the ae-plane as colored circles with the instantaneous values and crosses with the observed values. The vertical lines represent the location of the MMR for the 1:1, 3:2, 2:1, 5:2, and 3:1 resonances referring to the outermost planet (Planet b), and the red curve represents the minimum eccentricities required for debris to come within 3 Hill radii of Planet b. The lower row shows the normalized surface density profile. The dots indicate the radial bins for the surface density, and the solid and dashed black lines represent the fitted curve according to Equation (12) for the raw data and the data smoothed by a Gaussian beam size of 43 au, respectively. The locations of the planets are marked by vertical lines for reference. |
| In the text | |
|
Fig. 7 Evolution of the semimajor axis and eccentricity of Planet x in the five-planet model for varying initial conditions. The gray lines indicate 200 simulations employing the IAS 15 integrator with different initial values for the semimajor axis and true anomaly of Planet x. The red line represents the case displayed in Figures 8 and 9. |
| In the text | |
|
Fig. 8 Evolution of selected orbital parameters in the five-planet model. Left: evolution of the planetary semimajor axes, eccentricities, and the period ratio of adjacent-planet pairs. The results for planets e, d, c, b, and x are depicted with the same color-coding as in Figure 2, plus violet for Planet x. The gray region indicates the outer chaotic zone for Planet b, defined as 3 Hill radii. Right: resonant angles for each adjacent pair, trio, and quartet of planets. |
| In the text | |
|
Fig. 9 Same as Figure 6, but with an additional planet. The MMR lines are plotted with respect to Planet x. |
| In the text | |
|
Fig. 10 Radial intensity for the ALMA observation (orange line) along with our two relative intensity profiles for the four- and five-planet simulation in blue and green, respectively. The relative intensity of the simulation was calculated assuming that the planetesimals emit as blackbodies, following the relation I(r) ∝ Σ(r)r–1/2. The intensity was smoothed using a Gaussian filter of 43 au. The beam size is shown as the black line. The locations of Planet b (red) and Planet x (violet) are marked by vertical lines for reference. |
| In the text | |
Current usage metrics show cumulative count of Article Views (full-text article views including HTML views, PDF and ePub downloads, according to the available data) and Abstracts Views on Vision4Press platform.
Data correspond to usage on the plateform after 2015. The current usage metrics is available 48-96 hours after online publication and is updated daily on week days.
Initial download of the metrics may take a while.