Fig. 4
Download original image
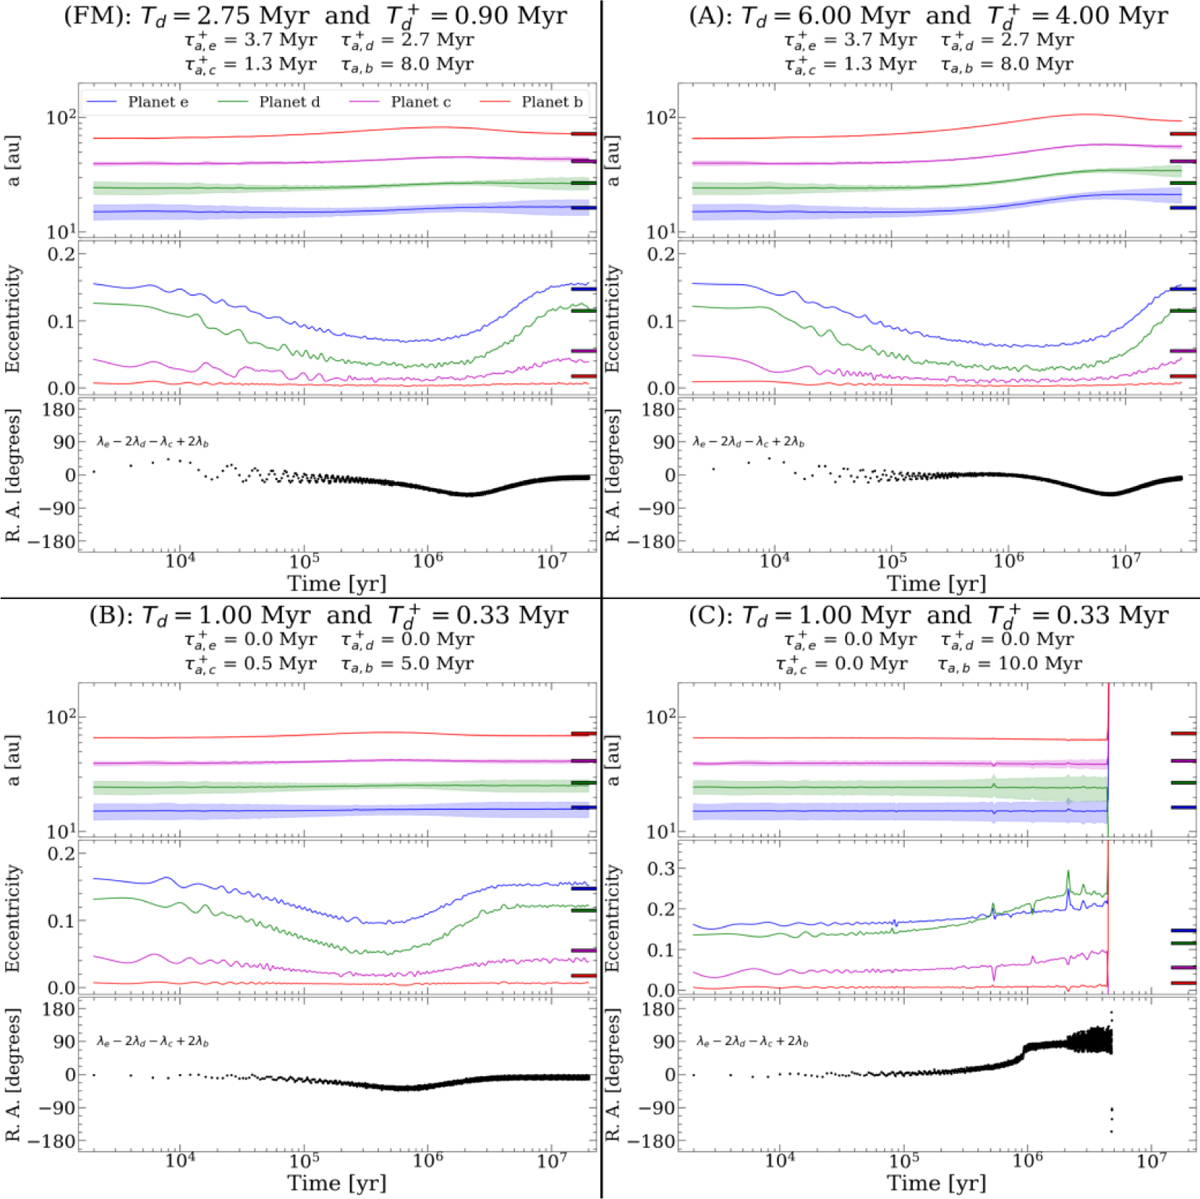
Four examples illustrating the dependence among the final planetary state, the disk lifetime (Td), and the duration of the outward migration (![]() ) along with the different values of τa,i and
) along with the different values of τa,i and ![]() . In each case, the upper panel shows the evolution of the semimajor axis (a) with shadows representing the variation in the pericenter and apocenter distances, the middle panel displays the eccentricity, and the bottom panel illustrates the evolution of the resonant angle (R.A.) for the four-planet architecture. The color-code used is the same as in Figure 2. The estimated semimajor axes and eccentricities of the observed planets are indicated by horizontal lines on the right border, which match the corresponding planet colors. Panel (FM) represents the fiducial model for four planets with the parameters listed in Table 1. Panel (A) presents a scenario with a longer disk lifetime and outward-migration duration, with Td = 6.00 Myr and
. In each case, the upper panel shows the evolution of the semimajor axis (a) with shadows representing the variation in the pericenter and apocenter distances, the middle panel displays the eccentricity, and the bottom panel illustrates the evolution of the resonant angle (R.A.) for the four-planet architecture. The color-code used is the same as in Figure 2. The estimated semimajor axes and eccentricities of the observed planets are indicated by horizontal lines on the right border, which match the corresponding planet colors. Panel (FM) represents the fiducial model for four planets with the parameters listed in Table 1. Panel (A) presents a scenario with a longer disk lifetime and outward-migration duration, with Td = 6.00 Myr and ![]() Myr until a final time of 30 Myr. It considers the same values for τa,i and
Myr until a final time of 30 Myr. It considers the same values for τa,i and ![]() as in the fiducial model. Panel (B) displays a model where the migration timescales for the two innermost planets are set to 0 Myr, whilst the migration evolution is maintained for the two outermost planets, as could arise if an inner cavity were present. The values Td and
as in the fiducial model. Panel (B) displays a model where the migration timescales for the two innermost planets are set to 0 Myr, whilst the migration evolution is maintained for the two outermost planets, as could arise if an inner cavity were present. The values Td and ![]() are set to 1.00 and 0.33 Myr, respectively. Panel (C) illustrates a model where the three innermost planets do not migrate, but only the outermost does inward.
are set to 1.00 and 0.33 Myr, respectively. Panel (C) illustrates a model where the three innermost planets do not migrate, but only the outermost does inward.
Current usage metrics show cumulative count of Article Views (full-text article views including HTML views, PDF and ePub downloads, according to the available data) and Abstracts Views on Vision4Press platform.
Data correspond to usage on the plateform after 2015. The current usage metrics is available 48-96 hours after online publication and is updated daily on week days.
Initial download of the metrics may take a while.