Fig. 6
Download original image
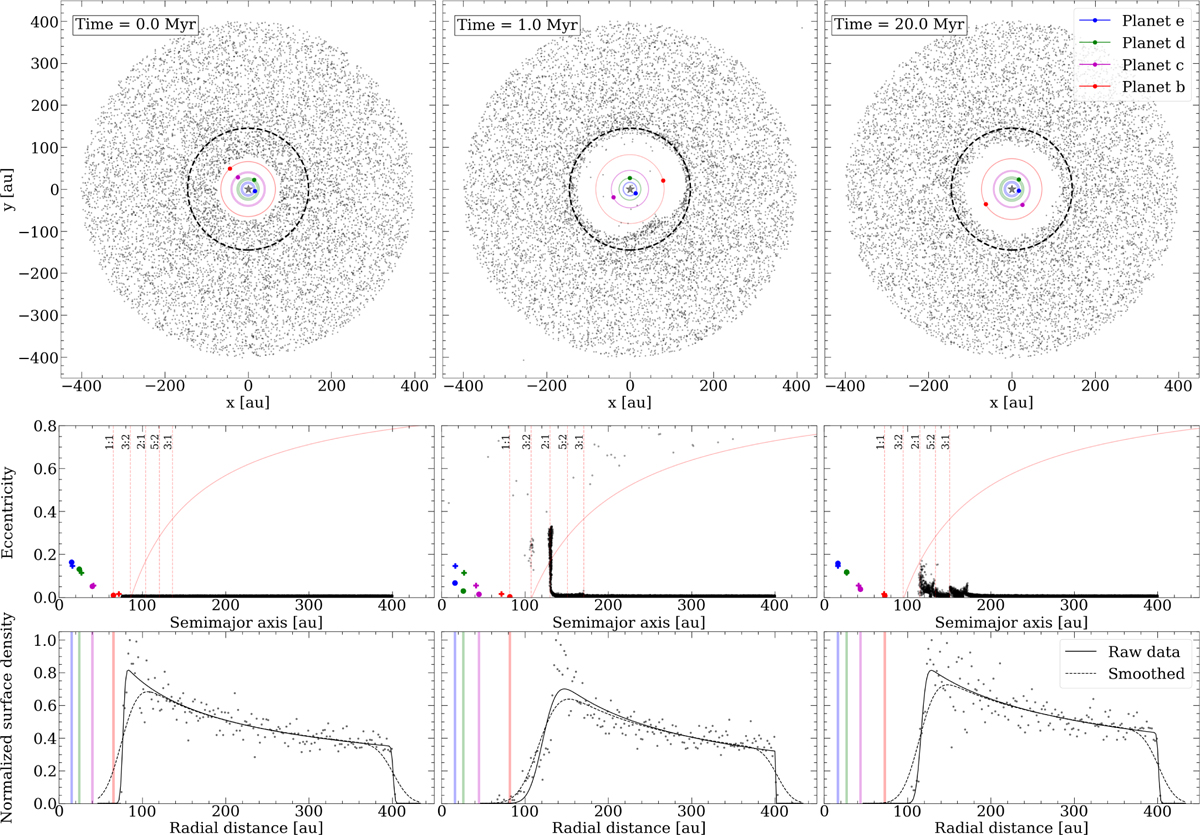
Snapshots showing the evolution of planetesimals at 0, 1.0, and 20 Myr from left to right. The upper row displays the planetesimal distribution in the xy-plane, the planets in colors (color-coded as in Figure 2), and the dashed black circle represents the proposed 145 au value of the observed central cavity. The middle row shows the ae-plane as colored circles with the instantaneous values and crosses with the observed values. The vertical lines represent the location of the MMR for the 1:1, 3:2, 2:1, 5:2, and 3:1 resonances referring to the outermost planet (Planet b), and the red curve represents the minimum eccentricities required for debris to come within 3 Hill radii of Planet b. The lower row shows the normalized surface density profile. The dots indicate the radial bins for the surface density, and the solid and dashed black lines represent the fitted curve according to Equation (12) for the raw data and the data smoothed by a Gaussian beam size of 43 au, respectively. The locations of the planets are marked by vertical lines for reference.
Current usage metrics show cumulative count of Article Views (full-text article views including HTML views, PDF and ePub downloads, according to the available data) and Abstracts Views on Vision4Press platform.
Data correspond to usage on the plateform after 2015. The current usage metrics is available 48-96 hours after online publication and is updated daily on week days.
Initial download of the metrics may take a while.